
Figures & data
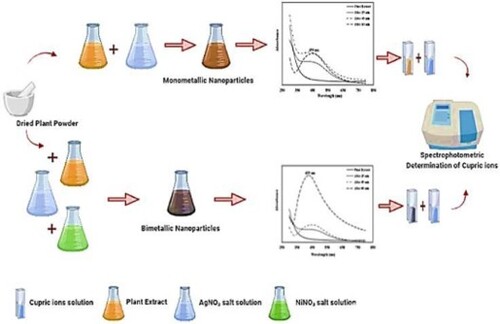
Figure 1. The UV-visible spectrum of silver nanoparticles (a) and the UV-visible spectrum of Ag-Ni bimetallic nanoparticles (b).
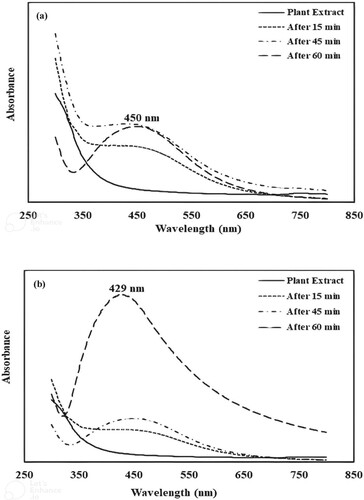
Figure 2. The FTIR spectrum of Araucaria bidwilli plant extract (a); the FTIR spectrum of silver nanoparticles (b) and the FTIR spectrum of Ag-Ni bimetallic nanoparticles (c).
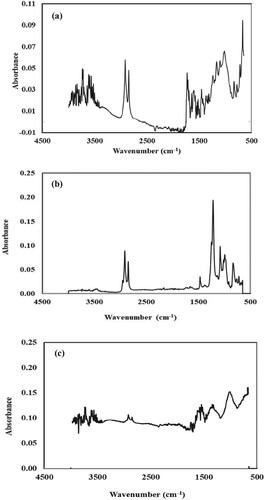
Figure 3. SEM images of silver monometallic nanoparticles (a–d): 500 nm (a); 1 µm (b), 2 µm (c) and 5 µm (d) and SEM images of silver nickel bimetallic nanoparticles (e-h): 500 nm (e); 1 µm (f); 2 µm (g) and 5 µm (h).
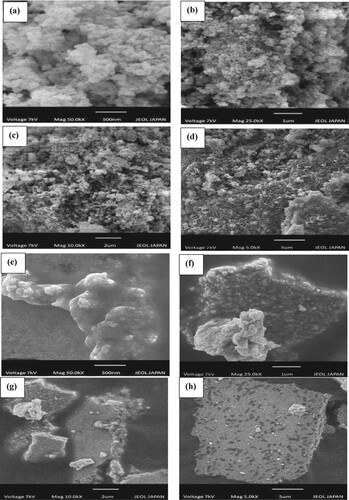
Figure 4. The EDX spectrum of monometallic nanoparticles (a) and the EDX spectrum of bimetallic nanoparticles (b).
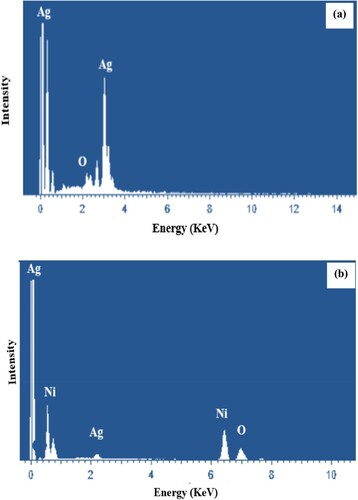
Table 1. Elemental composition percentage of Ag nanoparticles.
Table 2. Elemental composition percentage of Ag-Ni bimetallic nanoparticles.
Figure 5. X-ray diffractogram of silver monometallic nanoparticles (a) and X-ray diffractogram of silver nickel bimetallic nanoparticles (b).
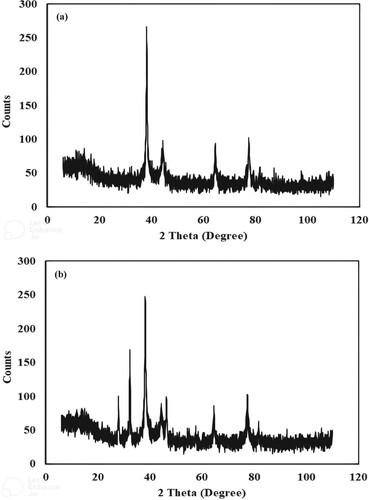
Figure 6. (a) Effect of pH on spectrophotometric determination of cupric ions using silver nanoparticles (AgNPs) and silver nickel nanoparticles (Ag-Ni NPs) (Conditions: concentration of cupric ions = 8 µM, volume of cupric ions = 0.1 mL, volume of nanocomposite = 3 mL and time of contact = 30 min); (b) Effect of time on spectrophotometric determination of cupric ions using silver nanoparticles (AgNPs) and silver nickel nanoparticles (Ag-Ni NPs) (Conditions: concentration of cupric ions = 8 µM, volume of cupric ions = 0.1 mL, volume of nanocomposite = 3 mL); (c) Effect of ionic strength on spectrophotometric determination of cupric ions using silver nanoparticles (AgNPs) and silver nickel nanoparticles (Ag-Ni NPs). (Conditions: concentration of cupric ions = 8 µM, volume of cupric ions = 0.1 mL, volume of nanocomposite = 3 mL, volume of NaCl = 0.1 mL and concentration of NaCl = 200–1000 µM); (d) Effect of copper concentration on spectrophotometric determination of cupric ion using silver nanoparticles (AgNPs) and silver nickel nanoparticles (Ag-Ni NPs) (Conditions: volume of cupric ions = 0.1 mL, volume of nanocomposite = 3 mL) and (e) Selectivity studies for spectrophotometric determination of cupric ions using silver nanoparticles (AgNPs) and silver nickel nanoparticles (Ag-Ni NPs) (Conditions: concentration of cupric or other metallic ions = 10 µM, volume of cupric ions or other metallic ions = 0.1 mL and volume of nanocomposite = 3 mL).
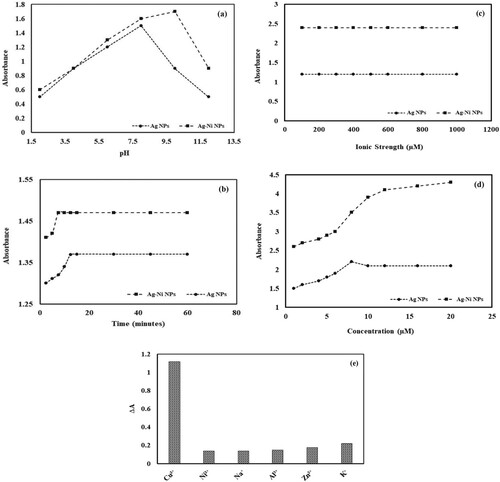
Table 3. Determination of Cu+2 in the real water sample.
Data availability statement
All data generated or analysed during this study are included in this submitted manuscript.