Figures & data
Table 1. List of species with their feeding and environmental habitats.
Figure 1. (a) Venn diagram based on environmental habitats; (b) Venn diagram based on feeding habitats; (c) Gut bacterial diversity at genus level using environmental habitats; (c) Gut bacterial diversity at genus level using feeding habitats; (d) the gut bacterial composition of top 30 genera using feeding habitats.
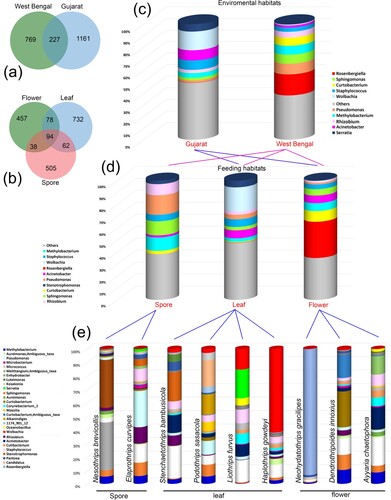
Figure 2. Alpha diversity of thrips species. (a–d) based on their environmental habitats; (e–h) based on their feeding habitats. (i–j) Principal Component Analysis plot; (i) plot on environmental habitats; (j) plot on feeding habitats.
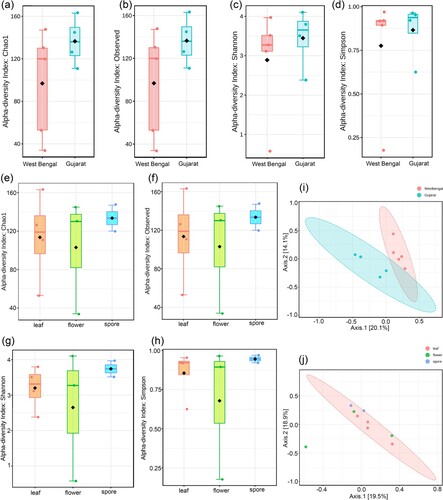
Figure 3. Dendrogram based on environmental and feeding habitats.
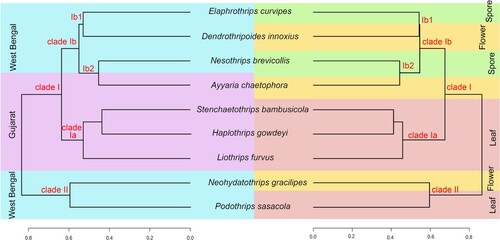
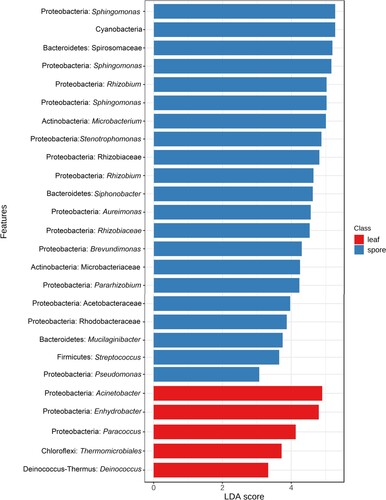
Figure 4. LEfSe analysis indicated the potential Biomarkers associated with their feeding habitats.