Figures & data
Figure 1. Effect of butin on catalepsy in rotenone treated rats. Values are expressed in mean ± S.E.M. (n = 6). #P < .05 when compared to normal control rats and *P < .01 and **P < .001 when compared to rotenone control rats. One-way ANOVA followed by Tukey’s post hoc test.
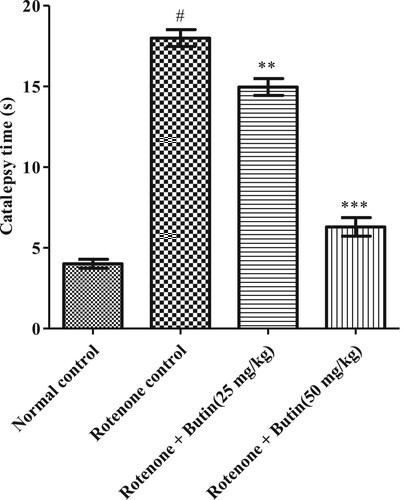
Figure 2. Effect of butin on akinesia in rotenone treated rats. Values are expressed in mean ± S.E.M. (n = 6). #P < 0.05 when compared to normal control rats and *P < .01 and **P < .001 when compared to rotenone control rats. One-way ANOVA followed by Tukey’s post hoc test.
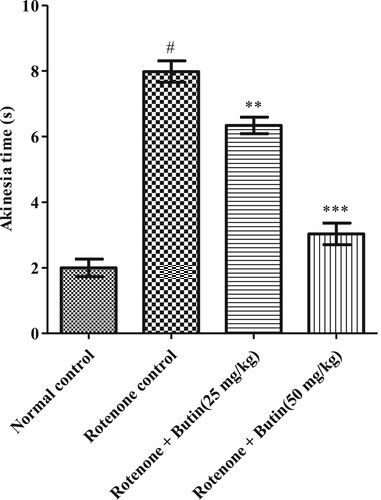
Figure 3. Effect of butin on elevated plus maze test in rotenone treated rats. Values are expressed in mean ± S.E.M. (n = 6). #P < .05 when compared to normal control rats and *P < .01 and **P < .001 when compared to rotenone control rats. One-way ANOVA followed by Tukey’s post hoc test.
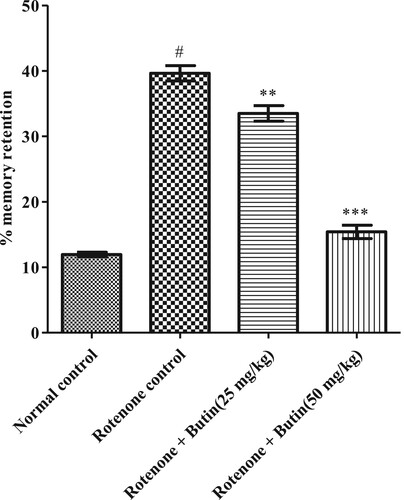
Figure 4. Effect of butin on modified forced swim testinrotenone treated rats. Values are expressed in mean ± S.E.M. (n = 6). #P < .05 when compared to normal control rats and *P < .01 and **P < .001 when compared to rotenone control rats. One-way ANOVA followed by Tukey’s post hoc test.
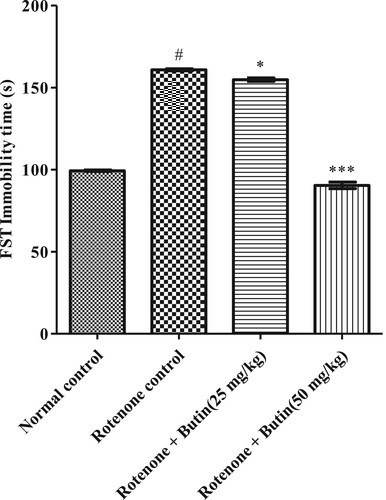
Figure 5. Effect of butin on acetylcholinesterase activity in rotenone treated rats. Values are expressed in mean ± S.E.M. (n = 6). #P < .05 when compared to normal control rats and *P < .01 and **P < .001 when compared to rotenone control rats. One-way ANOVA followed by Tukey’s post hoc test.
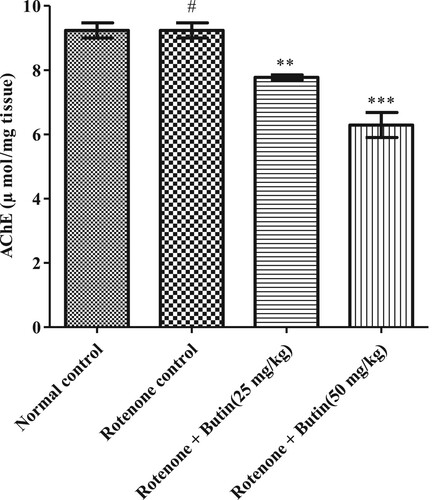
Figure 6. Effect of butin on butyrylcholinesterase activity in rotenone treated rats. Values are expressed in mean ± S.E.M. (n = 6). #P < .05 when compared to normal control rats and *P < .01 and **P < .001 when compared to rotenone control rats. One-way ANOVA followed by Tukey’s post hoc test.
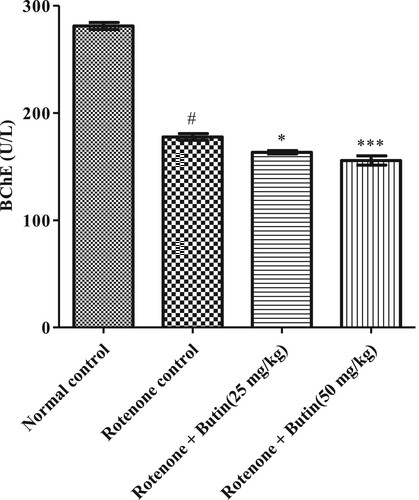
Figure 7. Effect of butin on paraoxonase-1 activity in rotenone treated rats. Values are expressed in mean ± S.E.M. (n = 6). #P < .05 when compared to normal control rats and *P < .01 and **P < .001 when compared to rotenone control rats. One-way ANOVA followed by Tukey’s post hoc test.
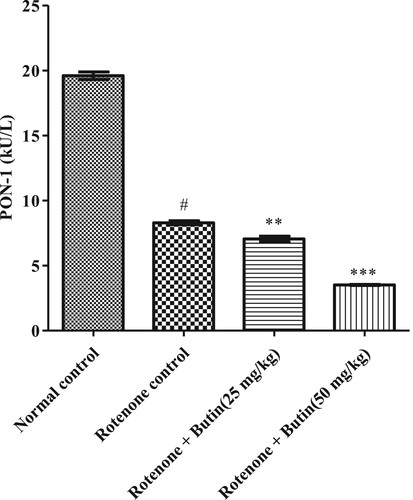
Figure 8. Effect of butin on GSH levels in rotenone treated rats. Values are expressed in mean ± S.E.M. (n = 6). #P < .05 when compared to normal control rats and *P < .01 and **P < .001 when compared to rotenone control rats. One-way ANOVA followed by Tukey’s post hoc test.
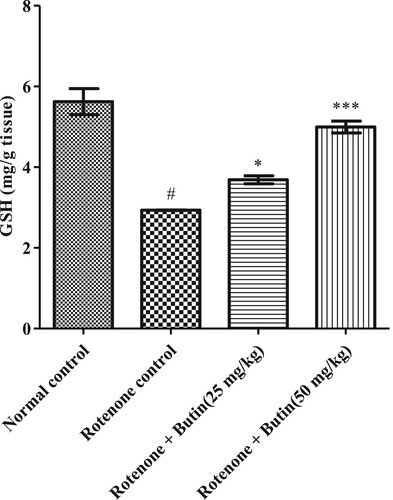
Figure 9. Effect of butin on catalase activity in rotenone treated rats. Values are expressed in mean ± S.E.M. (n = 6). #P < .05 when compared to normal control rats and *P < .01 and **P < .001 when compared to rotenone control rats. One-way ANOVA followed by Tukey’s post hoc test.
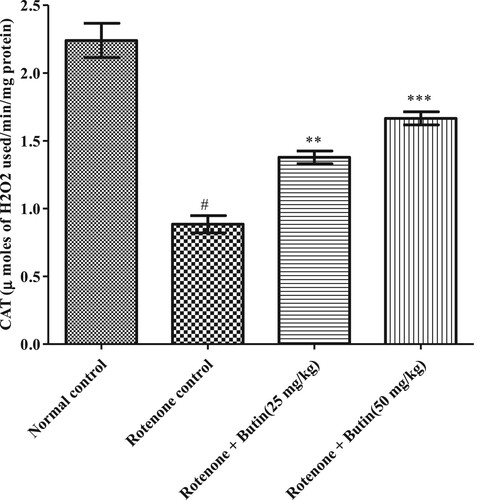
Figure 10. Effect of butin on SOD activities in rotenone treated rats. Values are expressed in mean ± S.E.M. (n = 6). #P < .05 when compared to normal control rats and *P < .01 and **P < .001 when compared to rotenone control rats. One-way ANOVA followed by Tukey’s post hoc test.
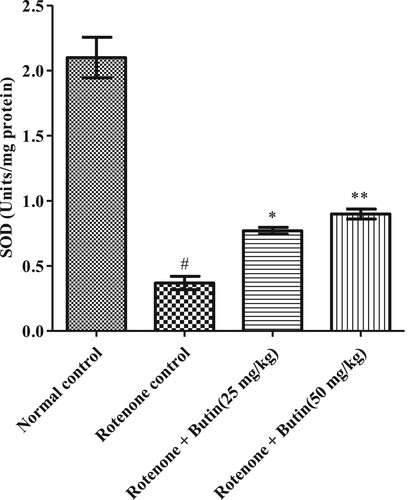
Figure 11. Effect of butin on MDA levels in rotenone treated rats. Values are expressed in mean ± S.E.M. (n = 6). #P < .05 when compared to normal control rats and *P < .01 and **P < .001 when compared to rotenone control rats. One-way ANOVA followed by Tukey’s post hoc test.
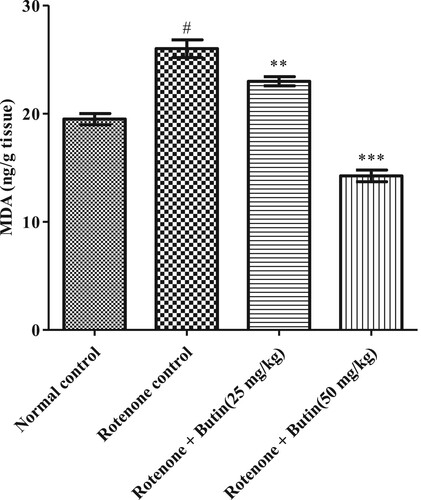
Figure 12. Effect of butin on nitrite levels in rotenone treated rats. Values are expressed in mean ± S.E.M. (n = 6). #P < .05 when compared to normal control rats and *P < .01 and **P < .001 when compared to rotenone control rats. One-way ANOVA followed by Tukey’s post hoc test.
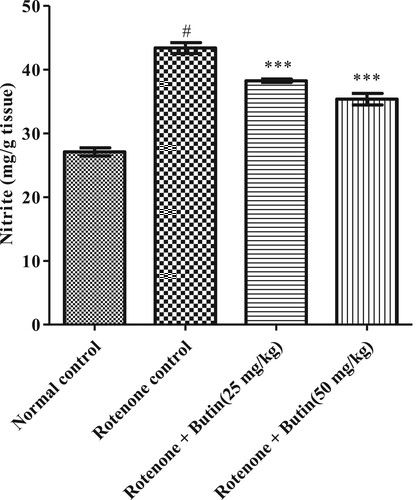
Figure 13. Effect of butin on TNF-α levels in rotenone treated rats. Values are expressed in mean ± S.E.M. (n = 6). #P < .05 when compared to normal control rats and *P < .01 and **P < .001 when compared to rotenone control rats. One-way ANOVA followed by Tukey’s post hoc test.

Figure 14. Effect of butin on IL-1β levels in rotenone treated rats. Values are expressed in mean ± S.E.M. (n = 6). #P < .05 when compared to normal control rats and *P < .01 and **P < .001 when compared to rotenone control rats. One-way ANOVA followed by Tukey’s post hoc test.
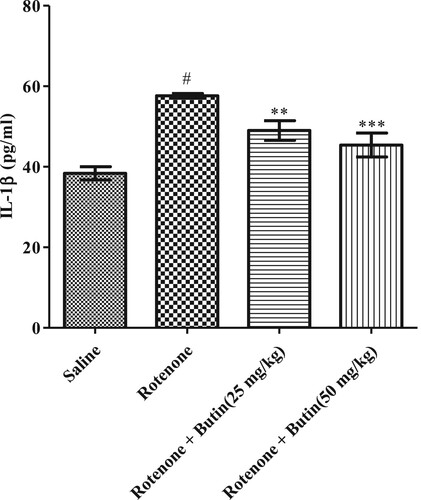
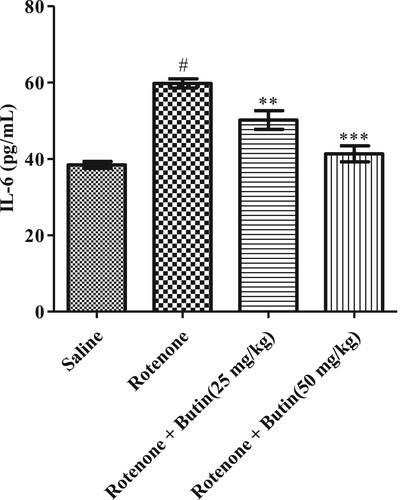
Figure 15. Effect of butin on IL-6 levels in rotenone treated rats. Values are expressed in mean ± S.E.M. (n = 6). #P < .05 when compared to normal control rats and *P < .01 and **P < .001 when compared to rotenone control rats. One-way ANOVA followed by Tukey’s post hoc test.