
Figures & data
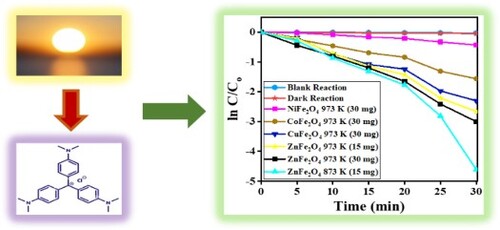
Figure 1. XRD patterns of the MFe2O4 nanocomposite photocatalysts.
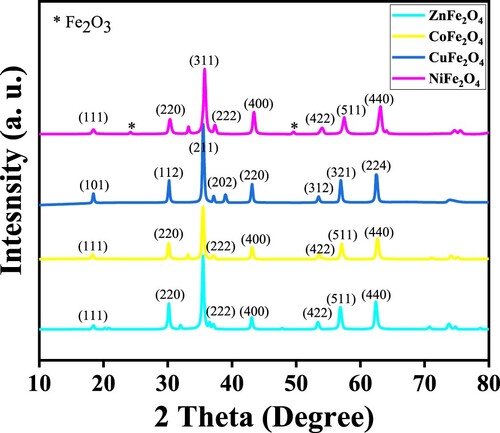
Table 1. Crystalline, interplanar spacing, particle sizes and lattice constant of MFe2O4 nanostructures calcined at 973 K for 24 h.
Figure 2. FT-IR spectra of MFe2O4 nanocomposite photocatalysts, calcined at 973 K for 24 h.
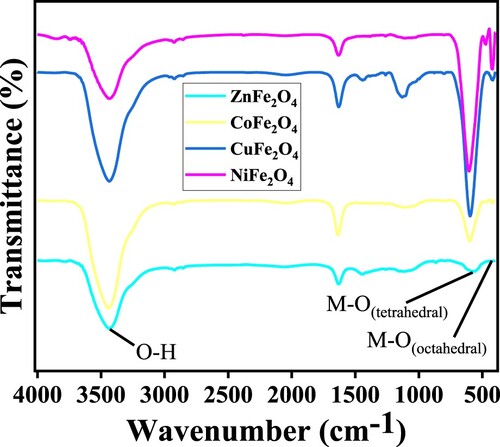
Figure 3. SEM images of (a) NiFe2O4; (b) CoFe2O4; (c) CuFe2O4; (d) ZnFe2O4, calcined at 973 K for 24 h.
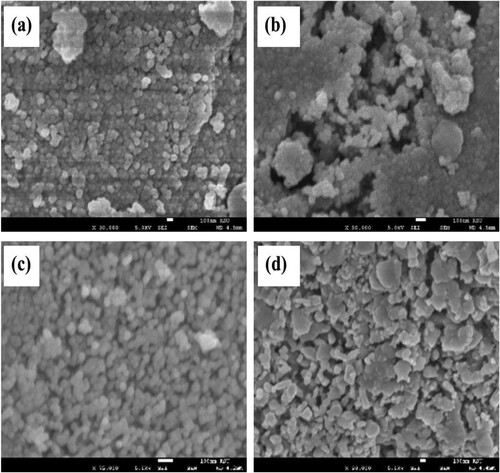
Figure 4. EDS analysis of (a) NiFe2O4; (b) CoFe2O4; (c) CuFe2O4; (d) ZnFe2O4, calcined at 973 K for 24 h.
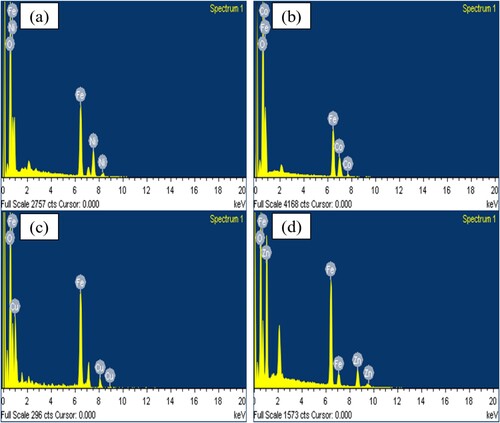
Figure 5. HRTEM results and particle size distributions of (a) NiFe2O4; (b) CoFe2O4; (c) CuFe2O4; (d) ZnFe2O4, calcined at 973 K for 24 h.
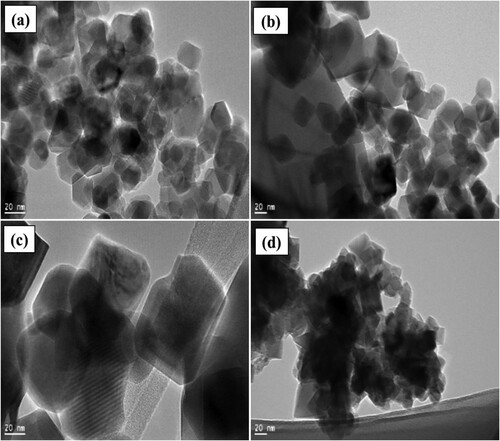
Figure 6. Particle size distributions of (a) NiFe2O4; (b) CoFe2O4; (c) CuFe2O4; (d) ZnFe2O4, calcined at 973 K for 24 h.
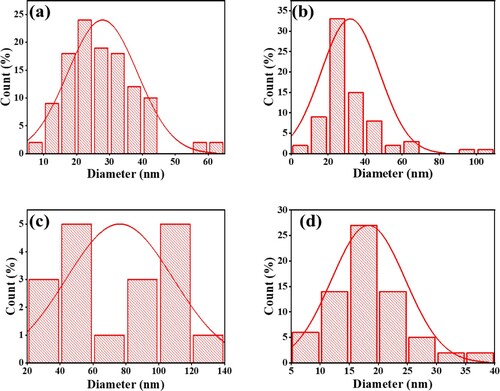
Figure 7. Nitrogen adsorption-desorption isotherms and pore size distribution of MFe2O4 photocatalysts.
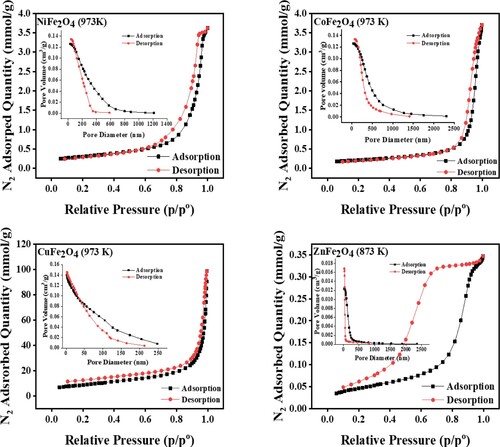
Table 2. Textural properties of MFe2O4 nanoparticles.
Figure 8. UV-Vis absorption spectra of MFe2O4 nanostructures.
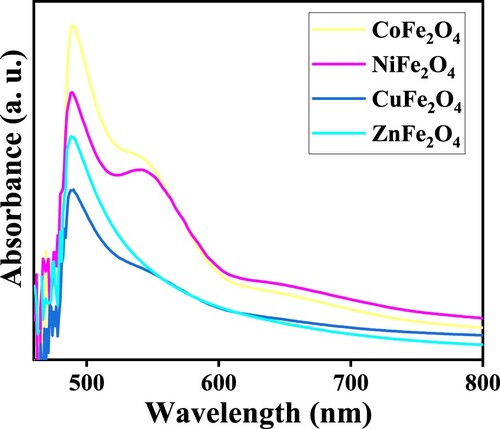
Figure 9. Plots of (Ahν)n as a function of photon energy (hν).
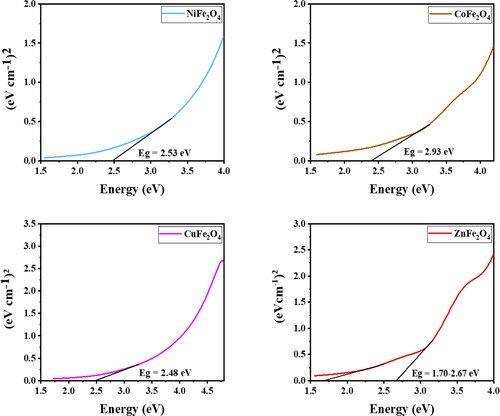
Figure 10. Photodegradation vs time of MFe2O4, calcined at 973 K for 24 h.
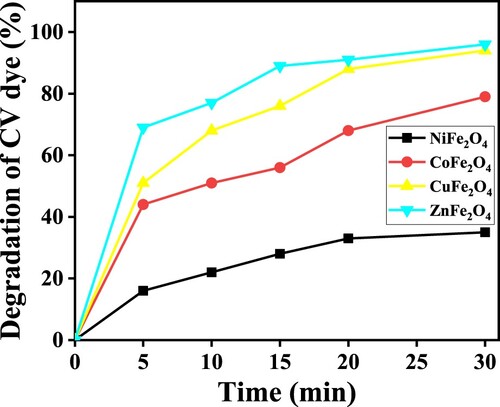
Figure 11. (a) Effect of calcination temperature of ZnFe2O4. (b) Effect of calcination duration upon photocatalytic activity of ZnFe2O4 (1:2) nanoparticles calcined at 873 K on the photodegradation of CV dye using 15 mg of photocatalyst, 10 ml of 10-ppm CV solution in sunlight and pH 7.
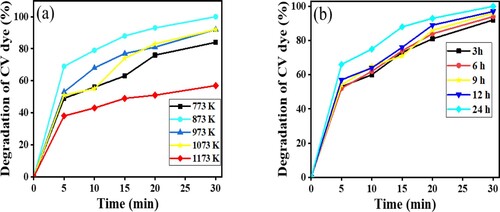
Figure 12. (a) effect of ratio of Zn/Fe, (b) effect of load of ZnFe2O4 (1:2) nanoparticles calcined at 873 K on the photodegradation of CV dye using 15 mg of photocatalysts, 10 ml of 10 ppm CV solution under sunlight radiation and at pH 7 for 30 min.
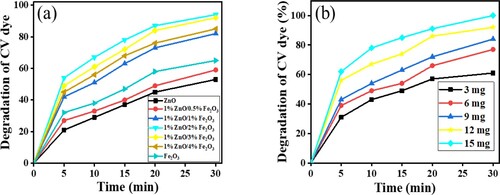
Figure 13. Time-dependent spectral changes to CV dye solution (a) dark reaction catalyzed by ZnFe2O4, calcined at 973 K; (b) blank reaction; (c) catalyzed reaction by ZnFe2O4, calcined at 873 K; (d) catalyzed reaction by ZnFe2O4, calcined at 973 K.
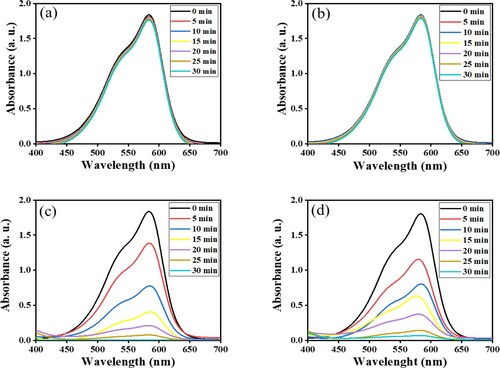
Figure 14. (a) C/Co vs time plot for the photocatalytic degradation of CV dye, and (b) the plot of ln (C/Co) vs time for the kinetic study by MFe2O4 photocatalysts.
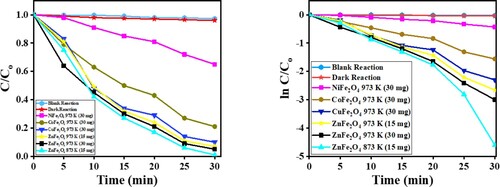
Table 3. Kinetic studies of photocatalytic degradation of CV dye using MFe2O4 nanostructures.
Figure 15. Degradation efficiency ZnFe2O4 per run, measured as the percentage of CV dye degraded by photocatalysts.
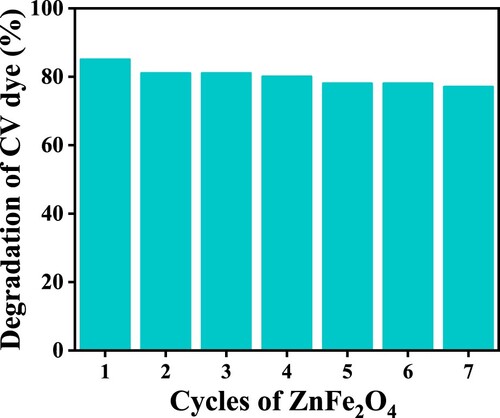
Figure 16. (a) XPS spectra; (b) Mott–Schottky plots; (c) scheme of energy with reduction potentials vs. NHE of ZnFe2O4 photocatalyst.
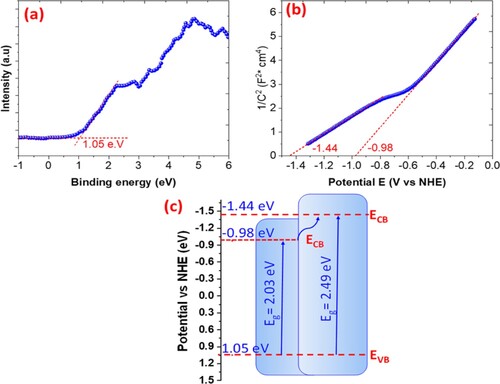
Figure 17. The rate of photocatalytic degradation of CV dye over ZnFe2O4 in the presence of active species.
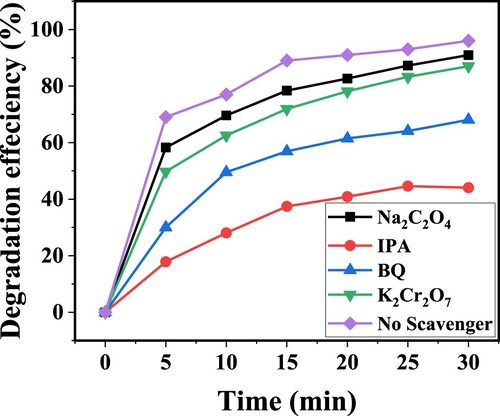
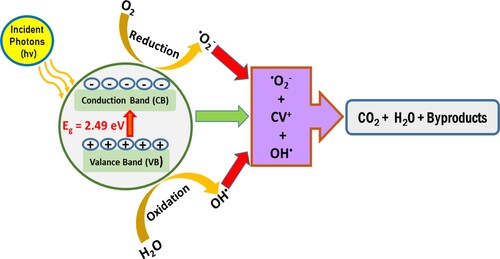
Figure 18. Scheme of the photocatalytic degradation mechanism of CV dye over ZnFe2O4 photocatalyst under sunlight irradiation.
Data availability statement
Not applicable.