Figures & data
Figure 1. The Cole-Cole diagram for LDPE samples after different contact times in the apple.
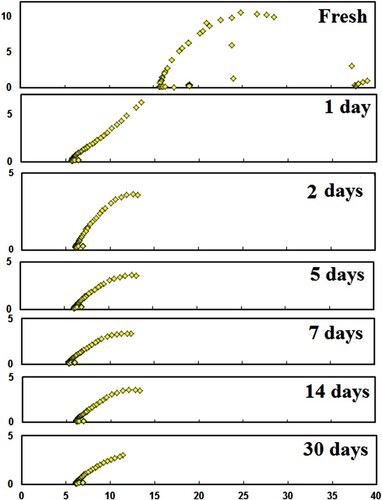
Figure 2. The Cole-Cole diagram for LDPE samples after different contact times in the pineapple.
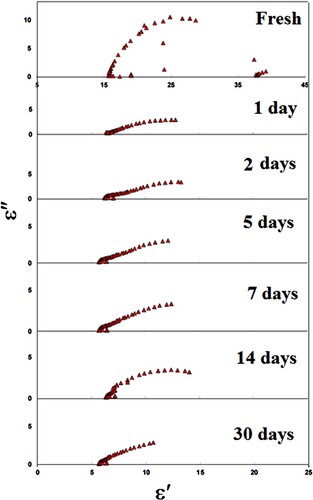
Figure 3. The Cole-Cole diagram for LDPE samples after different contact times in the mango.
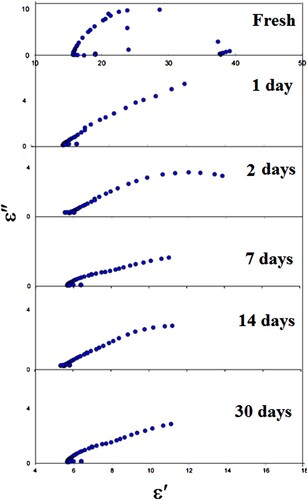
Figure 4. The Cole-Cole diagram for LDPE samples after different contact times in the cow’s milk.
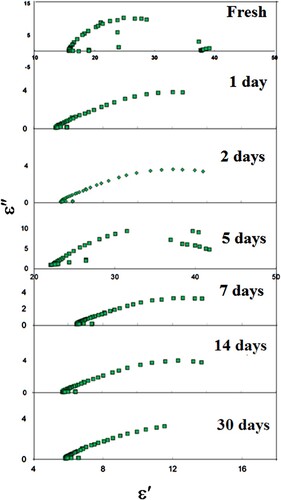
Figure 5. ε∞ of LDPE vs. contact time in apple, cow’s milk, pineapple, and mango.
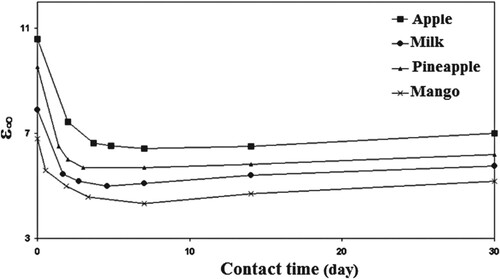
Figure 6. εo of LDPE vs. contact time in apple, cow’s milk, pineapple, and mango.

Figure 7. The parameter L of LDPE vs. contact time in apple, cow milk, pineapple, and mango.
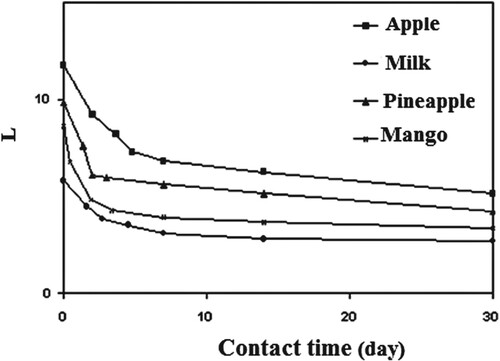
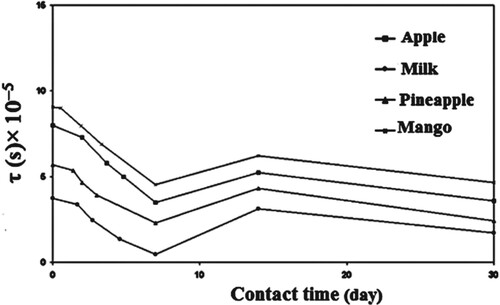
Figure 8. τ of LDPE vs. contact time in apple, cow’s milk, pineapple, and mango.