
Figures & data
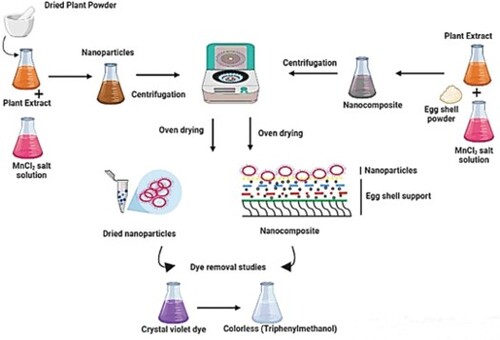
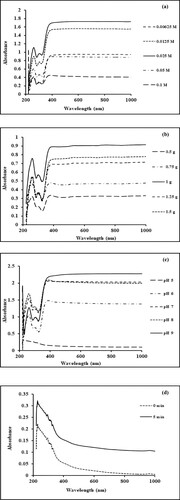
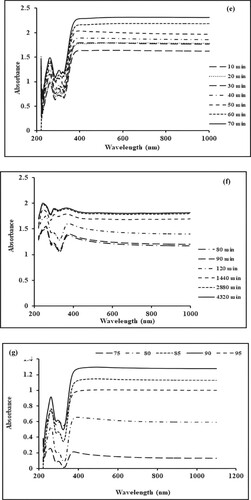
Figure 1. (a) Effect of precursor concentration on the biogenic synthesis of Mn dioxide NPs. (b) Effect of plant concentration on the biogenic synthesis of Mn dioxide NPs. (c) Effect of pH on the biogenic synthesis of Mn dioxide NPs. (d–f) Effect of nucleation time on the biogenic synthesis of Mn dioxide NPs. (g) Effect of temperature on the biogenic synthesis of Mn dioxide NPs.
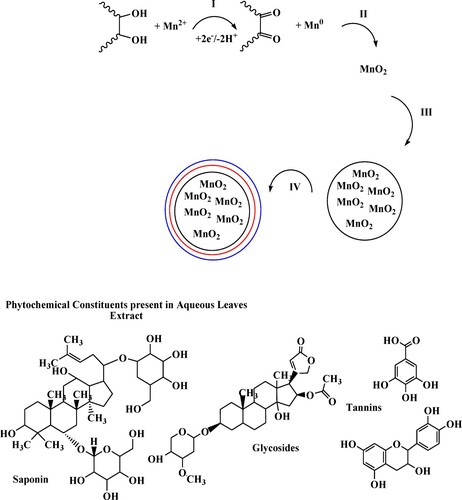
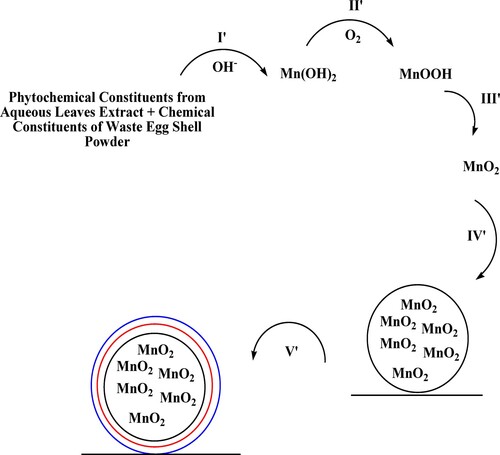
Scheme 1. Possible mechanism of MnO2 nanoparticle formation.
Scheme 2. Possible mechanism of MnO2@waste eggshell nanocomposite formation.
Scheme 3. Possible mechanism of dye removal procedure by MnO2 nanoparticles and MnO2@waste eggshell nanocomposite.
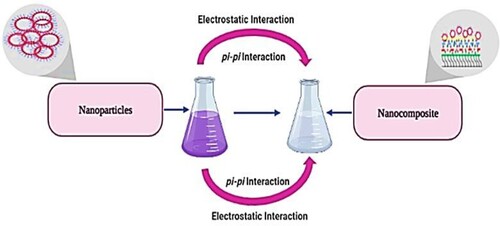
Figure 2. (a) UV-visible spectrum of aqueous leaf extract of Ocimum basilicum. (b) UV-Visible Spectrum of Mn dioxide NPs. (c) UV-visible spectrum of fabricated Mn oxide/eggshell as NC.
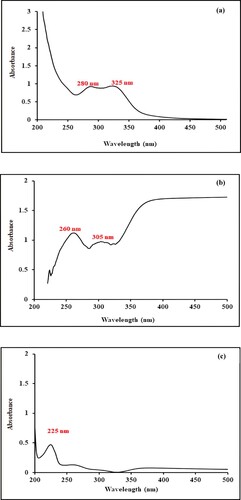
Figure 3. (a) FTIR Spectrum of Ocimum basilicum leaves extract. (b) FTIR Spectrum of biogenic synthesized Mn dioxide NPs. (c) FTIR Spectrum of eggshell. (d) FTIR Spectrum of nanocomposite.
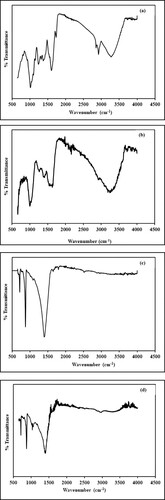
Figure 4. (a) XRD Spectrum of Mn dioxide NPs. (b) XRD Spectrum of nanocomposite.
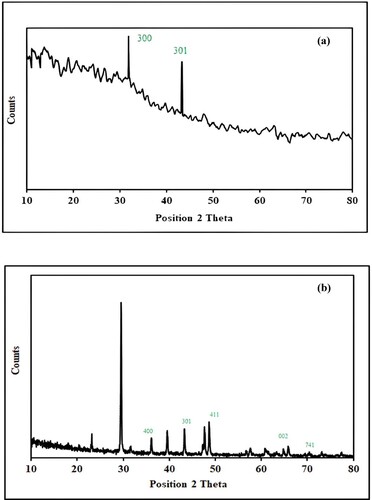
Figure 5. (a–c) SEM images of biosynthesized Mn dioxide NPs. (d–f) SEM images of fabricated Mn dioxide/eggshell NC.
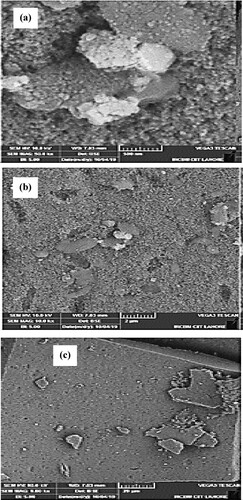
Figure 6. (a) EDX spectrum of biosynthesized Mn dioxide NPs. (b) EDX spectrum of biosynthesized Mn dioxide NPs/eggshell NC.
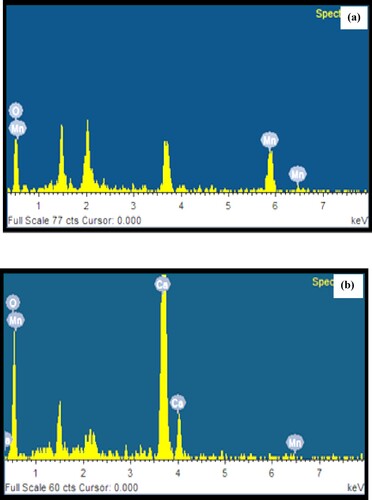
Figure 7. (a) Comparative graph showing the effect of dye concentration for the removal of crystal violet dye by Mn dioxide NPs and Mn dioxide/eggshell NC. (b) Comparative graph showing the effect of adsorbent dosage for removal of crystal violet dye by Mn dioxide NPs and Mn dioxide/eggshell NC. (c) Comparative graph showing the effect of pH for the removal of crystal violet dye by Mn dioxide NPs and Mn dioxide/eggshell NC. (d) Comparative graph showing the effect of temperature for the removal of crystal violet dye by Mn dioxide NPs and Mn dioxide/eggshell NC. (e) Comparative graph showing the effect of time for removal of crystal violet dye by Mn dioxide NPs and Mn dioxide/eggshell NC. (f) Comparative graph showing effect of ionic strength for removal of crystal violet dye by Mn dioxide NPs and Mn dioxide/eggshell NC. (g) Regeneration studies for removal of crystal violet dye by Mn dioxide NPs. (h) Regeneration studies for removal of crystal violet dye by Mn dioxide/eggshell NC.
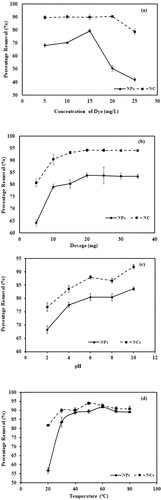
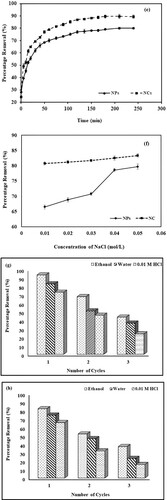
Table 1. Thermodynamic parameters calculated for CV dye removal by Mn dioxide NPs and Mn dioxide/eggshell NC.
Figure 8. (a) Plot of Langmuir isotherm for Mn dioxide NPs. (b) Plot of Langmuir isotherm for Mn dioxide/eggshell NC. (c) Plot of Freundlich isotherm for Mn dioxide NPs. (d) Plot of Freundlich isotherm for Mn dioxide/eggshell NC.
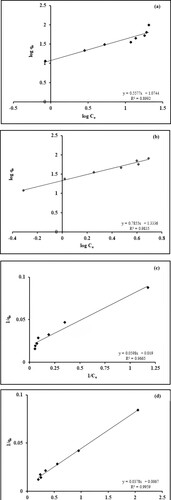
Table 2. Langmuir isothermal parameters for the removal of crystal violet dye by Mn dioxide NPs and Mn dioxide/eggshell NC.
Table 3. Freundlich isothermal parameters for the removal of crystal violet dye by Mn dioxide NPs and Mn dioxide/eggshells NC.
Table 4. Comparison of Mn dioxide NPs and Mn dioxide /eggshells NC with other reported adsorbents used for removal studies of CV dye.
Data availability statement
All data generated or analyzed during this study are included in this submitted manuscript and its supplementary information file.