Figures & data
Figure 1. The atomic inversion for asymmetric two atoms () at
,
; cases (A–D) black for
, blue for
, red for
, and green for
; while cases (E–H) black for
and
, blue for
and
, red for
and
and green for
and
. (A) First Atom; (B) First Atom; (C) Second Atom; (D) Second Atom; (E) First Atom; (F) First Atom; (G) Second Atom; (H) Second Atom.
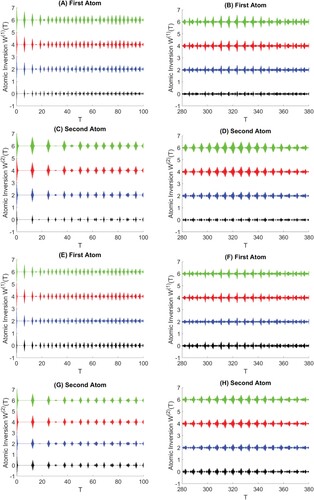
Figure 2. The atomic inversion for symmetric two atoms () at
,
; cases (A–B) black for
, blue for
, red for
and green for
, while cases (C–D) black for
and
, blue for
and
, red for
and
and green for
and
.
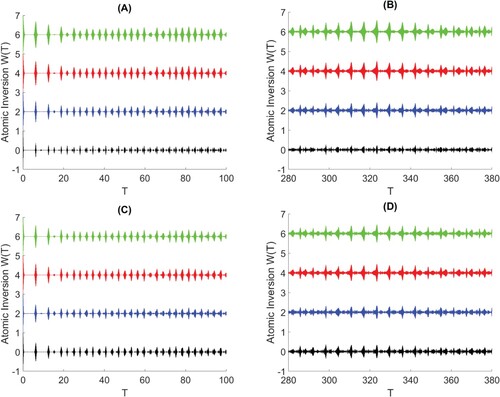
Figure 3. The von Neumann entropy for asymmetric two atoms (g = 0.5) at ,
; cases (A–D) black for
, blue for
, red for
, and green for
; while cases (E–H) black for
and
, blue for
and
, red for
and
and green for
and
. (A) First Atom; (B) First Atom; (C) Second Atom; (D) Second Atom; (E) First Atom; (F) First Atom; (G) Second Atom; (H) Second Atom.
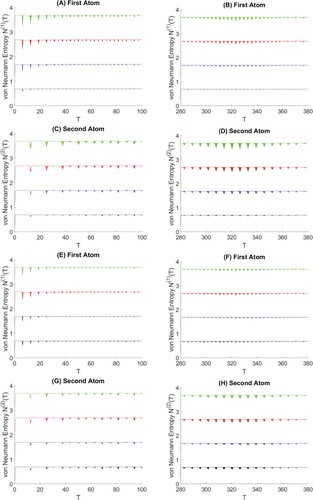
Figure 4. The y-component of the variance squeezing for asymmetric two atoms (g = 0.5) at ,
; cases in the second column are the same cases in first column with different time. (A) First Atom; (B) First Atom; (C) Second Atom; (D) Second Atom; (E) First Atom; (F) First Atom; (G) Second Atom; (H) Second Atom.
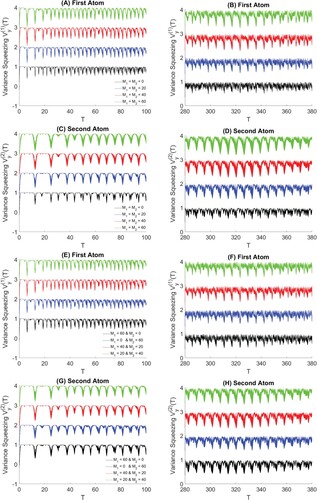
Figure 5. The correlation function for asymmetric two atoms (g = 0.5) at ,
; cases in the second column are the same cases in first column with different time. (A) First mode quantized field; (B) First mode quantized field; (C) Second mode quantized field; (D) Second mode quantized field; (E) First mode quantized field; (F) First mode quantized field; (G) Second mode quantized field; (H) Second mode quantized field.
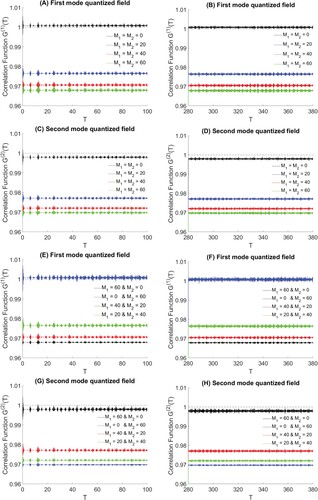
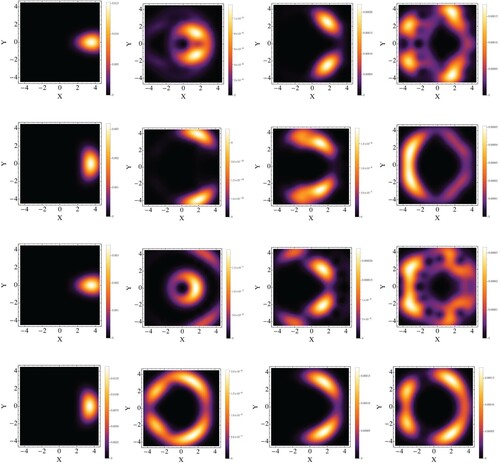
Figure 6. The Husimi function for the asymmetric two atoms (g = 0.5) at
,
with
and
; first row represents
, second row for
, third row for
and
, and the fourth row for
and
; while the columns represent given moments. The first column for T = 0, second column for T = 12.5, third column for T = 20 and the fourth column T = 324.