
Figures & data
Table 1. Slime phenotypes on Congo red agar.
Table 2. Association between patient’s characteristics, slime production and biofilm formation in MRSA isolates.
Figure 1. Specific biofilm formation index of all MRSA isolates.
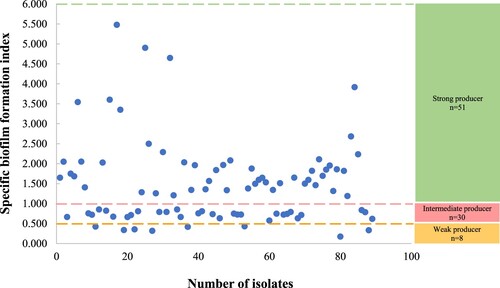
Figure 2. Representation of MSCRAMM genes amplified products on 1% (w/v) agarose gel electrophoresis. Lane L: 100 bp plus molecular weight marker; lane 1: Triplex 1 – cna (423 bp), eno (302 bp), ebps (186 bp); lane 2: Triplex 2 – sasC (936 bp), icaAD (520 bp), icaBC (182 bp); lane 3: Triplex 3 – fib (404 bp), clfA (292 bp), sasG (159 bp); lane 4: fnbA (643 bp); lane 5: fnbB (524 bp); lane 6: clfB (205 bp).
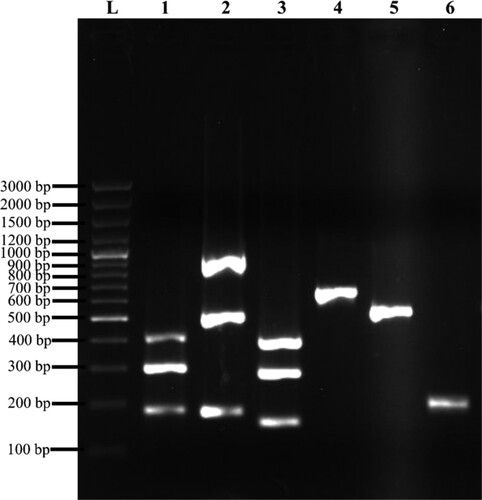
Table 3. Association between slime production, biofilm formation, MSCRAMM genes distribution and accessory gene regulator in MRSA isolates.