
Figures & data
Figure 1. The availability of water in the poison lake area during (A) and after (B) the rainy season in the year 2021.
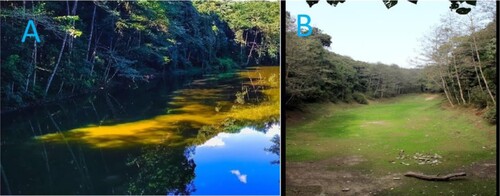
Figure 2. Location of the Poison Lake and its surrounding topography.
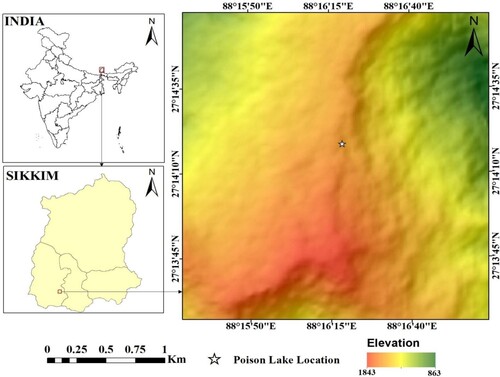
Figure 3. Geological setting (Lithostratigraphy, Lineament and Seismicity) of the Poison Lake and its surrounding area (Source: Bhattacharya and Mitra [Citation20], Hazarika and Ravi Kumar [Citation21], GSI [Citation22]).
![Figure 3. Geological setting (Lithostratigraphy, Lineament and Seismicity) of the Poison Lake and its surrounding area (Source: Bhattacharya and Mitra [Citation20], Hazarika and Ravi Kumar [Citation21], GSI [Citation22]).](/cms/asset/3839f418-0d37-48f7-90fd-2753b39a1f40/tusc_a_2153426_f0003_oc.jpg)
Figure 4. The Wenner Array Layout (Source: Kearey et al. [Citation23], Telford et al. [Citation24]).
![Figure 4. The Wenner Array Layout (Source: Kearey et al. [Citation23], Telford et al. [Citation24]).](/cms/asset/a7d62b57-89c6-4cb0-81ec-d66156043d1c/tusc_a_2153426_f0004_oc.jpg)
Figure 5. The Schlumberger (Symmetric) Array Layout [Citation23].
![Figure 5. The Schlumberger (Symmetric) Array Layout [Citation23].](/cms/asset/cbc69234-ae62-4e56-94c6-8cbb2ca6ea40/tusc_a_2153426_f0005_oc.jpg)
Figure 6. The Schlumberger (Asymmetric) Array Layout [Citation23,Citation24].
![Figure 6. The Schlumberger (Asymmetric) Array Layout [Citation23,Citation24].](/cms/asset/3cd4f758-18eb-4dd7-90e4-8c62d633b753/tusc_a_2153426_f0006_oc.jpg)
Figure 7. Full-azimuthal Schlumberger Geometry. The collinear array is rotated from N10°W azimuth, at a step of 45°, through 360°. Complementary angles are 180° offset (Source: Ogunbo et al. [Citation25]).
![Figure 7. Full-azimuthal Schlumberger Geometry. The collinear array is rotated from N10°W azimuth, at a step of 45°, through 360°. Complementary angles are 180° offset (Source: Ogunbo et al. [Citation25]).](/cms/asset/92aa70f5-4146-40ec-9883-324db9750639/tusc_a_2153426_f0007_oc.jpg)
Figure 8. Flow chart of the methodology.
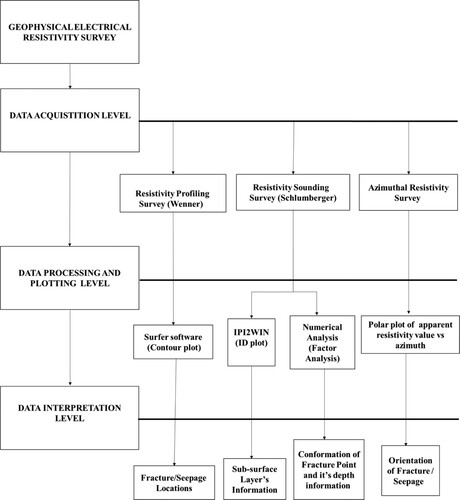
Figure 9. The Wenner profiling survey at the Poison Lake, Sikkim.
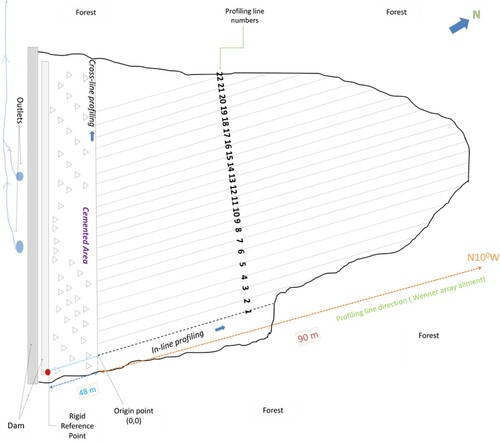
Figure 10. Fieldwork carried out at the Poison Lake, Sikkim, India.
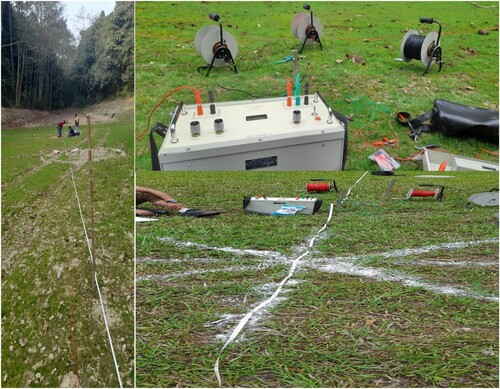
Table 1. Geo-electrical areal profiling survey using the Wenner array configuration at the Poison Lake.
Figure 11. (A) Contour plot of the Geo-Electrical Areal Profiling Survey using the Wenner Array configuration (B) Field location of two identified fractures at the Poison Lake.
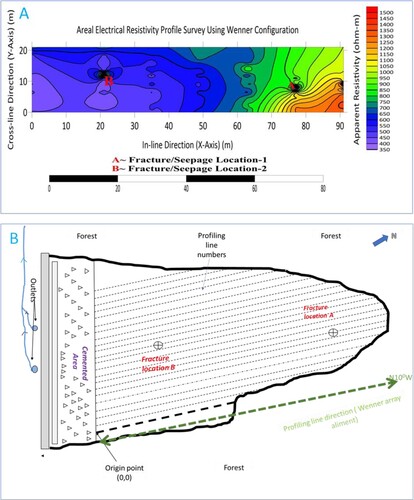
Table 2. An electrical sounding survey using the Schlumberger array configuration at the Poison Lake.
Figure 12. (A to D) Apparent resistivities vs. AB/2 for VES-1 to 4 were plotted on a log-log plot using IPI2Win software.[A]: ρ1<ρ2>ρ3<ρ4 (KH- Type) VES-1, [B]:ρ1>ρ2<ρ3<ρ4 (HA-Type)VES-2 [C]: ρ1>ρ2<ρ3<ρ4 (HA- Type) VES-3 [D]: ρ1<ρ2<ρ3<ρ4 (AA-Type) VES-4.
![Figure 12. (A to D) Apparent resistivities vs. AB/2 for VES-1 to 4 were plotted on a log-log plot using IPI2Win software.[A]: ρ1<ρ2>ρ3<ρ4 (KH- Type) VES-1, [B]:ρ1>ρ2<ρ3<ρ4 (HA-Type)VES-2 [C]: ρ1>ρ2<ρ3<ρ4 (HA- Type) VES-3 [D]: ρ1<ρ2<ρ3<ρ4 (AA-Type) VES-4.](/cms/asset/d7501a55-dd83-4996-a377-50668473682a/tusc_a_2153426_f0012_oc.jpg)
Table 3. Delineation of fractured using numerical analysis (factor) of the Schlumberger resistivity sounding data.
Figure 13. (A to B) Apparent resistivity and its corresponding factor plot for the four VES (Log-Log plot).
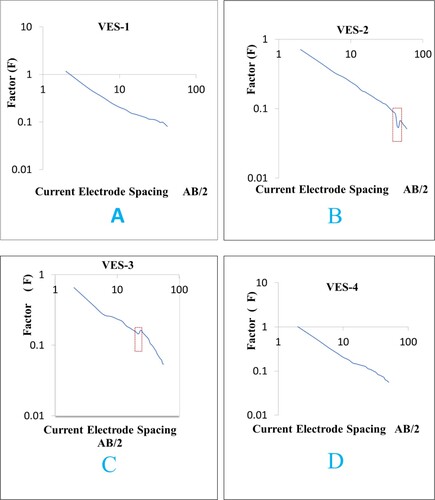
Figure 14. Polar plot of apparent resistivity values versus azimuth. The orientation of the arrow (Green colour) shows the orientation of the dominant fracture orientation or seepage direction.
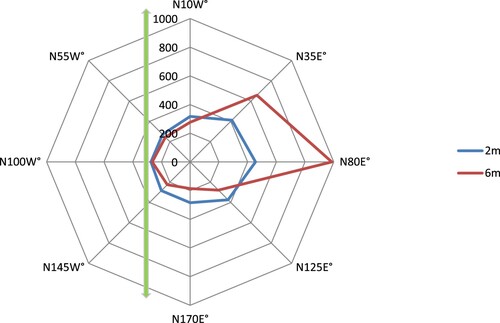
Table 4. Result of the azimuthal resistivity survey at location B using the Schlumberger array.