
Figures & data
Figure 1. XRD pattern for the hematite α-Fe2O3-RNPs prepared by hydrothermal method.
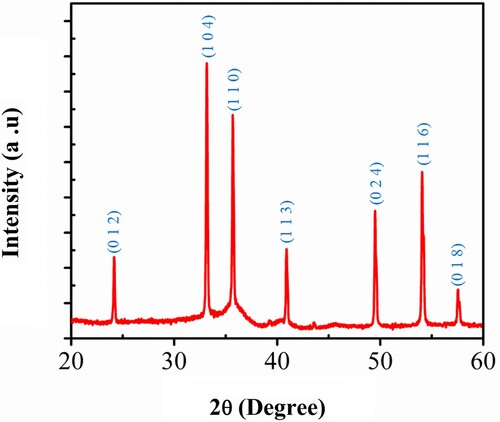
Figure 2. (a-c) SEM micrographs of the resulting α-Fe2O3-RNPs products synthesized, (d) EDS of α-Fe2O3-RNPs sample prepared by the hydrothermal autoclave method.
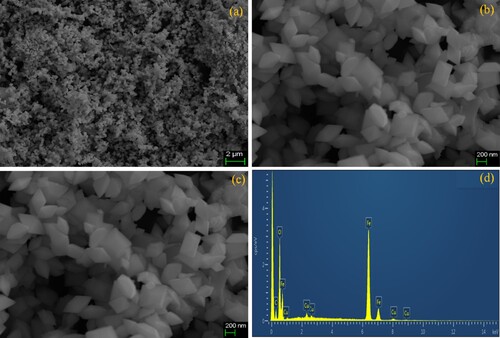
Figure 3. FTIR spectra of the resulting α-Fe2O3-RNPs catalyst synthesized by hydrothermal method.
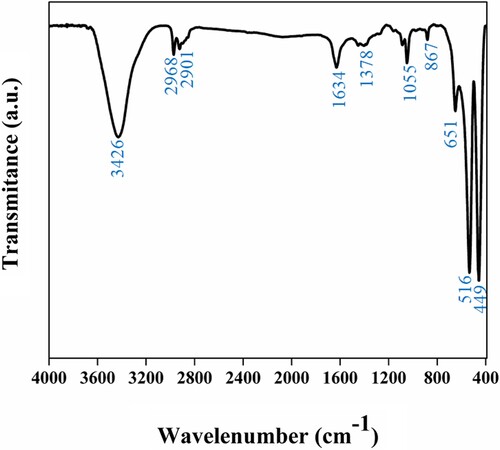
Figure 4. XPS of the α-Fe2O3-RNPs (a) survey spectrum, (b) core level of C 1s spectra, (c) core level O 1s spectra and (d) core level Fe 2p spectra.
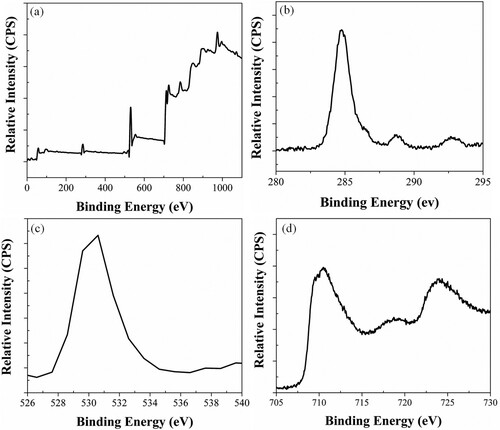
Figure 5. (a) Plot of C/C0 for the decolourization of MO and MB dyes under visible light irradiations. (b) α-Fe2O3-RNPs dosage effect, (c) Effect of the initial dye concentration on photocatalytic degradation of MO (d) Effect of the initial dye concentration on photocatalytic degradation of MB (e) Error bar graph of Photocatalytic activity of α-Fe2O3-RNPs against MO with cycling (f) Error bar graph of Photocatalytic activity of α-Fe2O3-RNPs against MO with cycling.
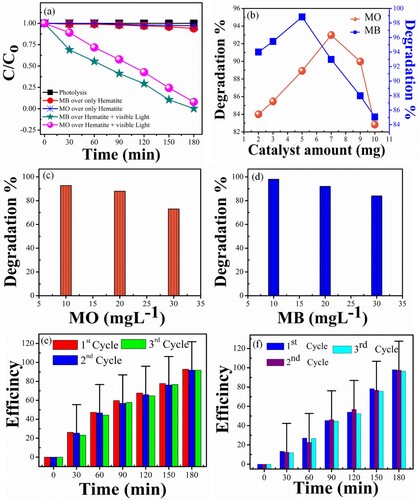
Figure 6. N2 adsorption-desorption isotherm dispersal curves for surface area (inset) the pore dispersing curves of as-synthesized α-Fe2O3-RNPs catalyst.
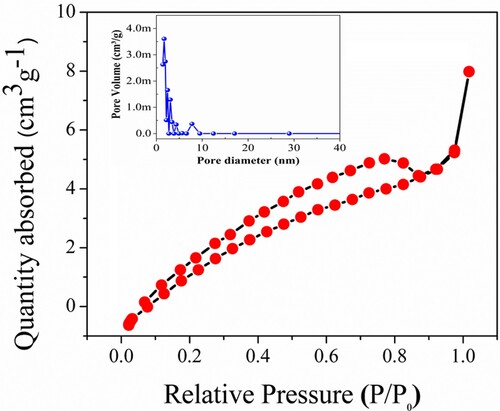
Figure 7. (a) Photoluminescence spectra of α-Fe2O3-RNPs, (b) EIS spectra of the bare and α-Fe2O3 electrode.
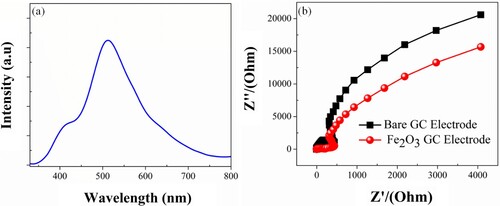
Figure 8. Proposed antibacterial and anti-acne activity of α- Fe2O3-RNPs against selected pathogenic microbes.
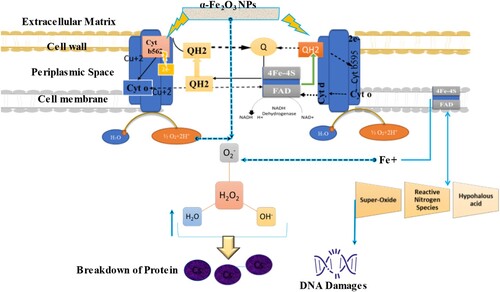
Table 1. ZOI (mm) values of the synthesized α-Fe2O3-RNPs against the pathogenic microbe.
Data availability
Data will be made available on request.