Figures & data
Figure 1. Effect of table salt and natural sea salt in different groups: the normal control (N.C.) group; the normal table salt (N.T.S.) group; the normal sea salt (N.S.S.) group; the doxorubicin-induced cardiac dysfunction control (D.C.) group; the ddoxorubicin-induced cardiac dysfunction control + table salt (D.T.S.) group; the ddoxorubicin-induced cardiac dysfunction control + sea salt (D.S.S.) group on Renin, Ang II, CKMB, IL-6 and IL-10 levels. N.T.S and N.S.S. groups are compared to the N.C. group, D.T.S and D.S.S. groups are compared to D.C., and the D.C group is compared to the N.C. group; values are mean ± SEM; n = 6; <.05(*), <0.01(**) and <.001(***).
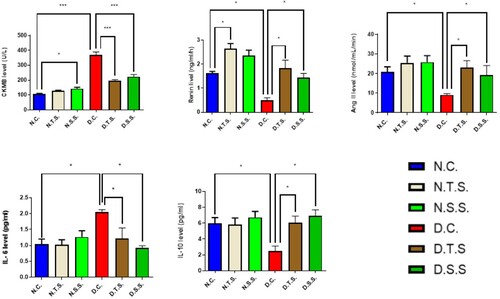
Table 1. Comparative analysis of salts with/without disease in terms of mean and SEM for creatine kinase myocardial band (CKMB), renin, angiotensin II (Ang II), interleukin-6 (IL-6) and interleukin-10 (IL-10).
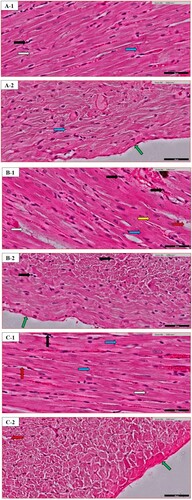
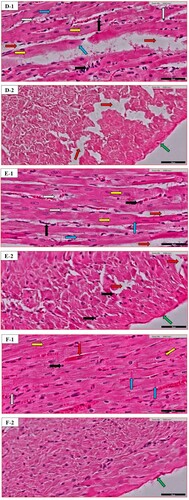
Table 2. Variations of the characteristics of heart histopathology of random images in different groups: the Normal control (N.C.) group; (B) the Normal table salt (N.T.S.) group; (C) the Normal sea salt (N.S.S.) group; (D) the Doxorubicin-induced cardiac dysfunction control (D.C.) group; (E) the Doxorubicin-induced cardiac dysfunction control + Table salt (D.T.S.) group; (F) the Doxorubicin-induced cardiac dysfunction control + Sea salt (D.S.S.) group. The results are depicted in Figure . (−) Normal effect; (+) Slight effect (++) Mild effect; (+++) Severe effect.
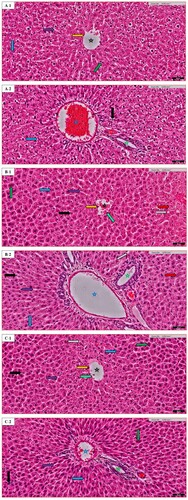
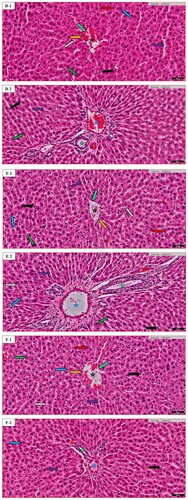
Table 3. Variations of the characteristics of liver histopathology of random images in different groups: (A) the Normal control (N.C.) group; (B) the Normal table salt (N.T.S.) group; (C) the Normal sea salt (N.S.S.) group; (D) the Doxorubicin-induced cardiac dysfunction control (D.C.) group; (E) the Doxorubicin-induced cardiac dysfunction control + Table salt (D.T.S.) group; (F) the Doxorubicin-induced cardiac dysfunction control + Sea salt (D.S.S.) group. The results are depicted in figures N. (−) Normal effect; (+) Slight effect (++) Mild effect; (+++) Severe effect.
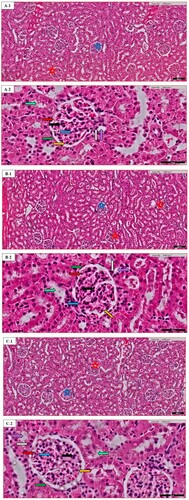
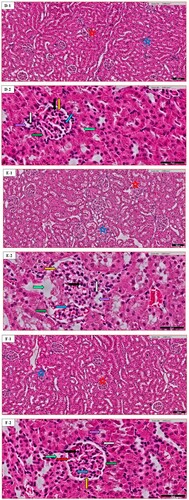
Table 4. Variations of the characteristics of kidney histopathology of random images in different groups: the Normal control (N.C.) group; (B) the Normal table salt (N.T.S.) group; (C) the Normal sea salt (N.S.S.) group; (D) the Doxorubicin-induced cardiac dysfunction control (D.C.) group; (E) the Doxorubicin-induced cardiac dysfunction control + Table salt (D.T.S.) group; (F) the Doxorubicin-induced cardiac dysfunction control + Sea salt (D.S.S.) group. The results are depicted in Figure . (−) Normal effect; (+) Slight effect (++) Mild effect; (+++) Severe effect.