Figures & data
Table 1. Experimental ranges and coded levels of independent variables for dextransucrase production.
Figure 1. Dextransucrase productivity by wild and mutant strains of Weissella confusa KIBGE-IB38. Tukey’s test was performed. # represents a significant difference as compared to the wild with P < 0.001.
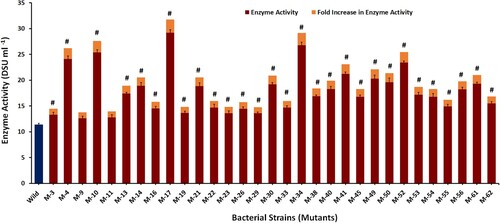
Figure 2. Pareto chart illustrating the effect of independent variables on dextransucrase production (the blue colour represents a negative effect and the orange colour represents a positive effect).
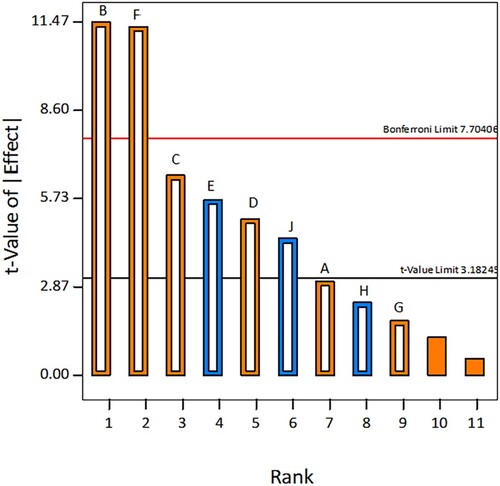
Table 2. Plackett-Burman experimental design of independent variables with the experimental and predicted values for dextransucrase production.
Table 3. ANOVA of Plackett-Burman design for dextransucrase production.
Table 4. Central composite experimental design of independent variables including the coded levels, actual values, predicted values and residuals for dextransucrase production.
Table 5. ANOVA of central composite model for dextransucrase production.
Figure 3. Diagnostic Plots for dextransucrase production. (A) Normal probability plot of residuals (B) Residuals vs. Predicted values (C) Residuals vs. Experimental runs (D) Actual vs. Predicted values.
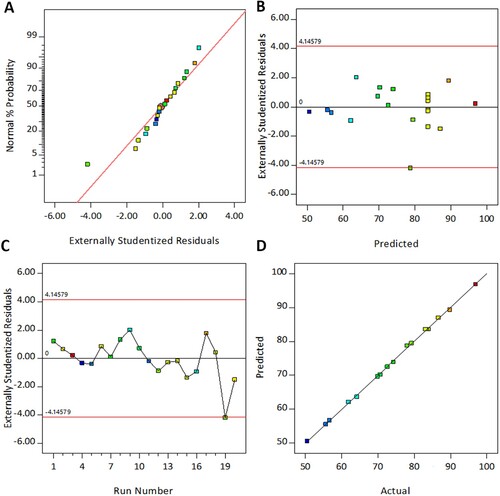
Figure 4. Contour and three-dimensional response surface plots showing the effect of independent variables on dextransucrase production. (A and B) temperature vs. sucrose (C and D) temperature vs. peptone (E and F) sucrose vs. peptone.
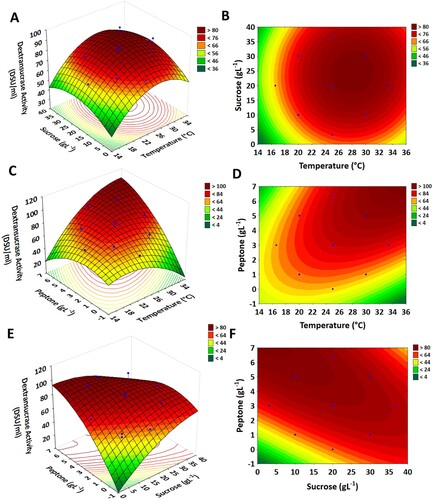
Figure 5. SEM analysis of dextran produced by the biocatalysis of dextransucrase.
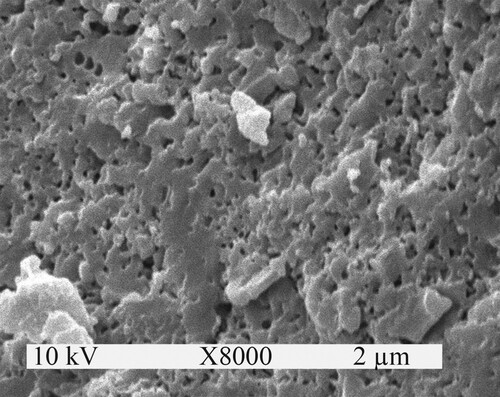
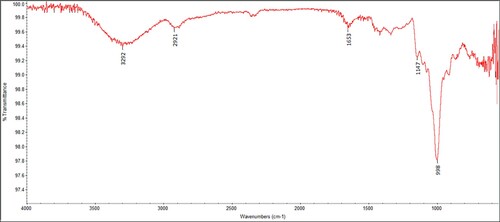
Figure 6. FTIR spectrum of dextran produced by the biocatalysis of dextransucrase.