Figures & data
Figure 1. Panels (a) and (b) show the nuclear matter density distributions of 9C as logarithmic and linear scales, respectively.
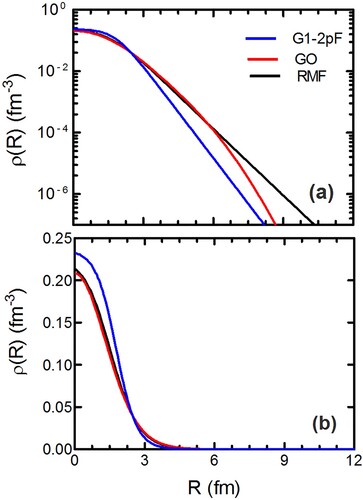
Figure 2. The variation of real folded potential depths by using different density forms of different NN interactions for 9C + 208Pb system at 227 MeV.
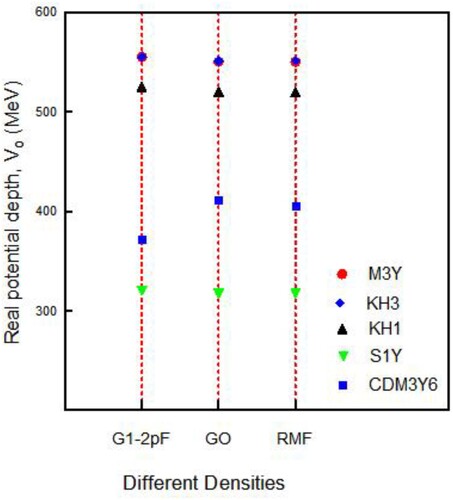
Figure 3. The real folded potentials by using RMF density form and different NN interactions for 9C + 208Pb system at 227 MeV.
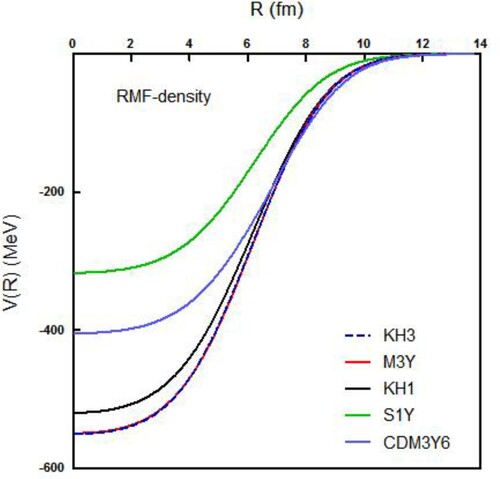
Figure 4. The normalized real folded potentials by using different-NN interactions form and different 9C densities for 9C + 208Pb system at 227 MeV in FM-1 scenario.
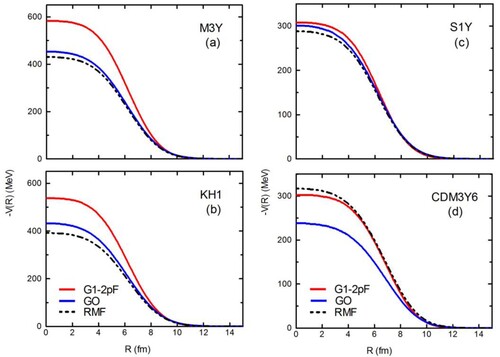
Figure 5. The elastic-scattering differential cross sections in comparison with the experimental data of the 9C+ 208Pb reaction at 227 MeV [Citation11] by using different combination of densities and NN interactions within DFP of scenario FM-1.Labels indicated on the figures.
![Figure 5. The elastic-scattering differential cross sections in comparison with the experimental data of the 9C+ 208Pb reaction at 227 MeV [Citation11] by using different combination of densities and NN interactions within DFP of scenario FM-1.Labels indicated on the figures.](/cms/asset/f921f70b-571c-4001-b066-60d36f157b46/tusc_a_2175577_f0005_oc.jpg)
Figure 6. The elastic-scattering differential cross sections in comparison with the experimental data of the 9C+ 208Pb reaction at 227 MeV [Citation11] by using different combination of densities and NN interactions within DFP of scenario FM-2. Labels indicated on the figures
![Figure 6. The elastic-scattering differential cross sections in comparison with the experimental data of the 9C+ 208Pb reaction at 227 MeV [Citation11] by using different combination of densities and NN interactions within DFP of scenario FM-2. Labels indicated on the figures](/cms/asset/3c051af5-ca03-49a2-92a6-c5122b6a7772/tusc_a_2175577_f0006_oc.jpg)
Table 1. Best-fit parameters of the double folded potentials (DFPs) using the two scenarios; FM-1 and FM-2 for 9C + 208Pb scattering data at 227 MeV.
Figure 7. Modulus of the scattering matrix to the calculated real folded potential by using RMF density and S1Y-NN interaction within DFP of scenarios; FM-1 and FM-2 versus the orbital angular momentum (L).
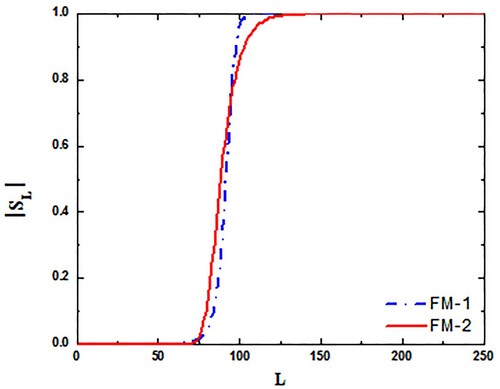
Table 2. Values of some characteristic quantities accompanied by the best-fit parameters of the selected bold case in Table .
Figure 8. Radial sensitivity of elastic-scattering differential cross sections to the calculated real folded potential by using RMF density and S1Y-NN interaction within DFP of scenario FM-1.
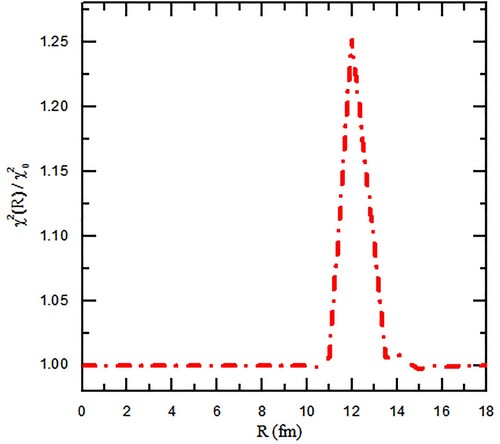
Figure 9. The elastic scattering calculated with different values of real folded potential renormalization factor (NR) by using RMF density and S1Y-NN interaction added to WS imaginary potential within the folding model (FM-1) compared with experimental data as linear and logarithmic scales.
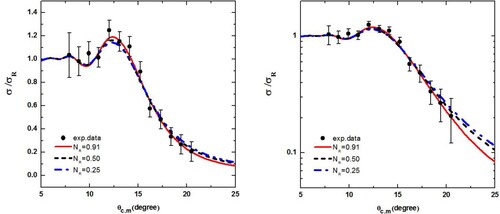
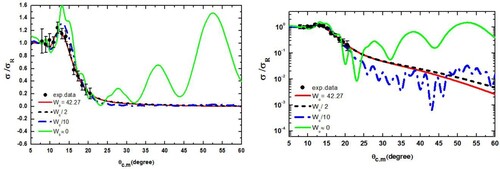
Figure 10. The elastic scattering was calculated with different values of imaginary potential depth (Wo) added to real folded potential by using RMF density and S1Y-NN interaction within folding model (FM-1) compared with experimental data as linear and logarithmic scales.