Figures & data
Table 1. Glass code, compositions, density ( and molar volume (
) of the studied glasses.
Figure 1. XRD pattern of the as-quenched samples.
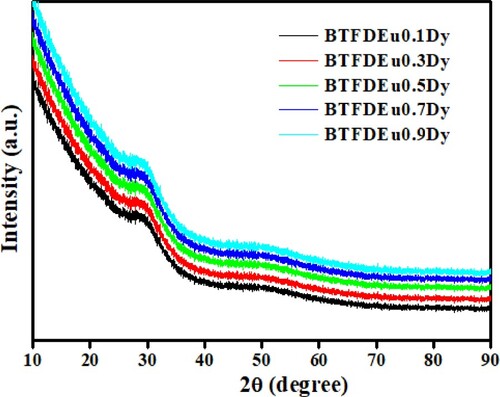
Figure 2. (a) EDX spectra (Inset SEM image and weight percent table) and (b) EDX maps of BTDEu0.5Dy glass.
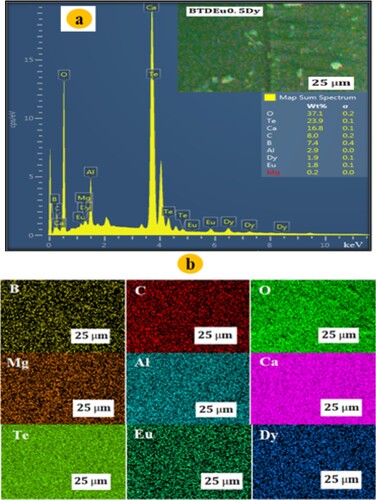
Figure 3. Variation of density and molar volume of the glasses against Dy2O3 contents.
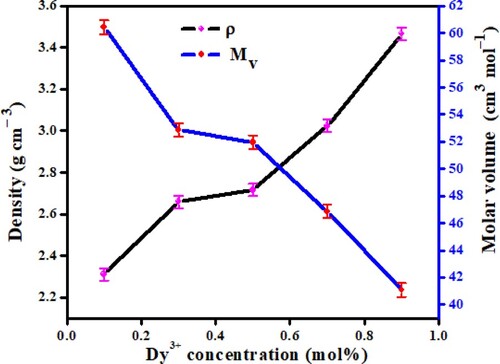
Figure 4. FTIR spectra of the prepared glasses.
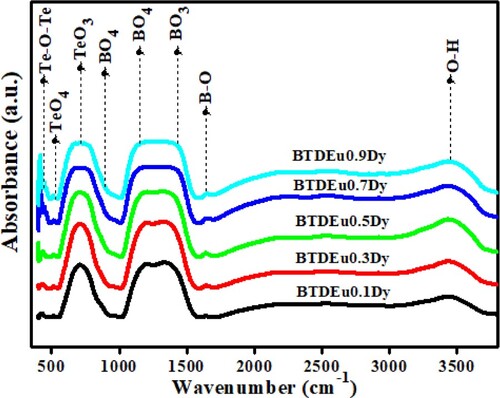
Figure 5. Raman spectra of the selected glasses.
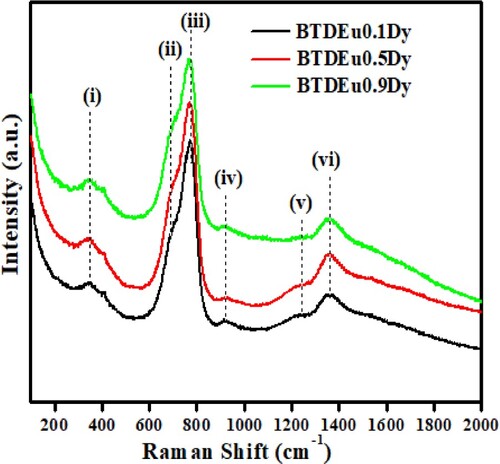
Table 2. Comparison of the obtained Raman peak positions and assignments with other studies.
Figure 6. Deconvoluted FTIR spectra of (a) BTDEu0.3Dy, (b) BTDEu0.5Dy and (c) BTDEu0.7Dy glass fitted to Gaussian-Lorentzian function.
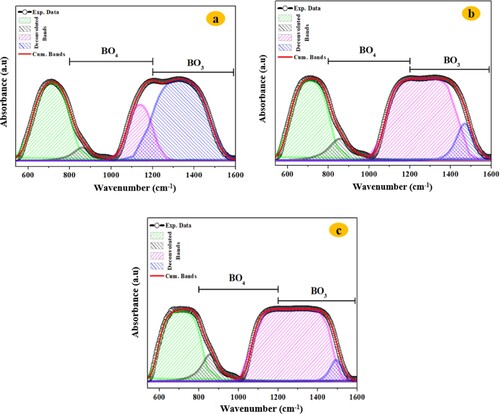
Figure 7. Deconvoluted Raman spectra of a selected glass.
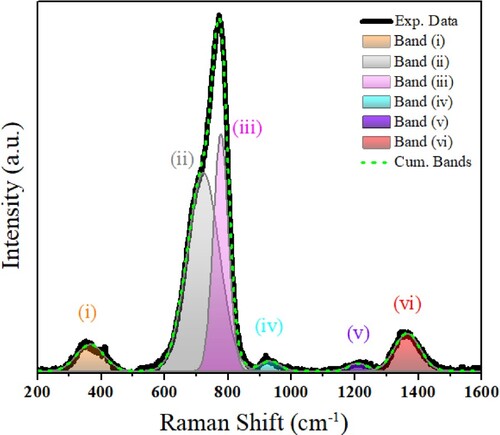
Table 3. Relative area of the deconvoluted FTIR and Raman bands alongside N4.
Figure 8. Dy ions contents dependent (a) TeO4 ratio and (b) N4 ratio of the studied glasses obtained from FTIR and Raman analysis.
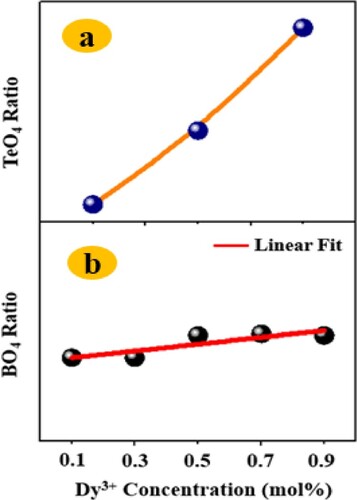
Figure 9. Glass hardness against applied load.
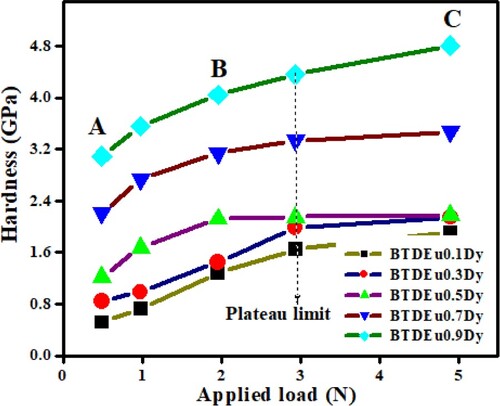
Figure 10. Variation of glass ultrasonic velocities against Dy2O3 contents.
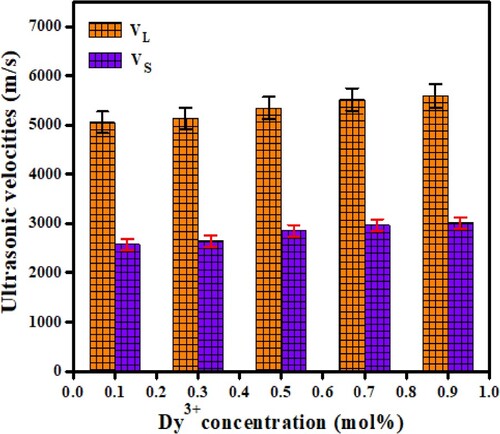
Figure 11. Variation of glass elastic moduli against Dy2O3 contents.
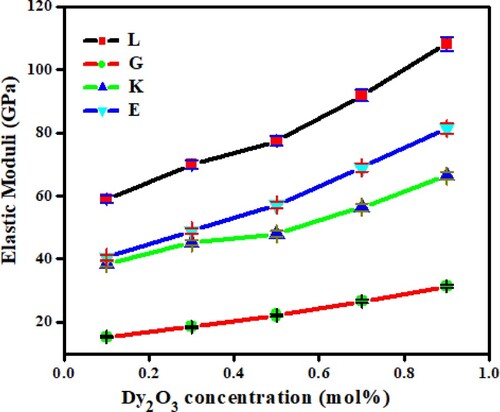
Table 4. Ultrasonic velocities, elastic modulus, Poisson ratio and fractal bond connectivity of the present glass system compared to other reported works.
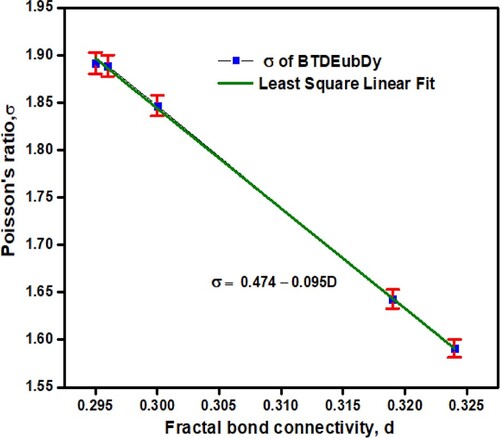
Figure 12. Correlation between the fractal bond connectivity and Poisson’s ratio of the produced BTDEubDy glass system.