
Figures & data
Figure 1. XRD diffraction data for PVP/CMC/x wt% melanin polymers.
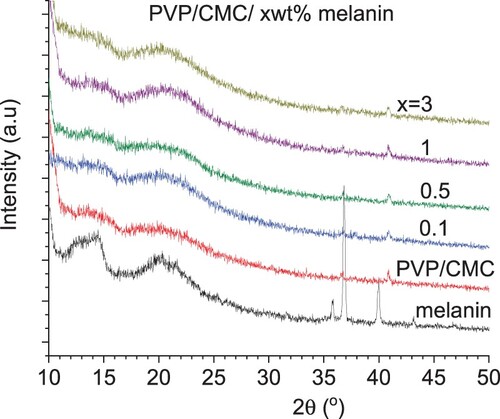
Figure 2. SEM and EDS images for PVP/CMC (a) without and (b) with melanin (1 wt %).
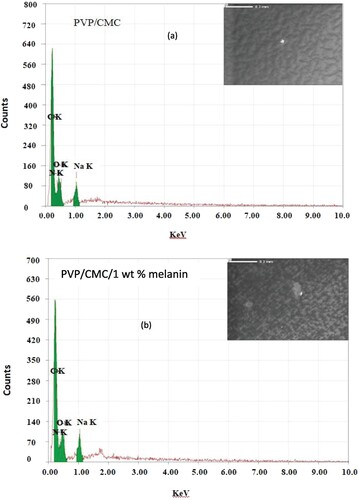
Figure 3. (a) Absorbance, (b) transmittance and (c) reflectance spectra for PVP/CMC/x wt% melanin polymers.
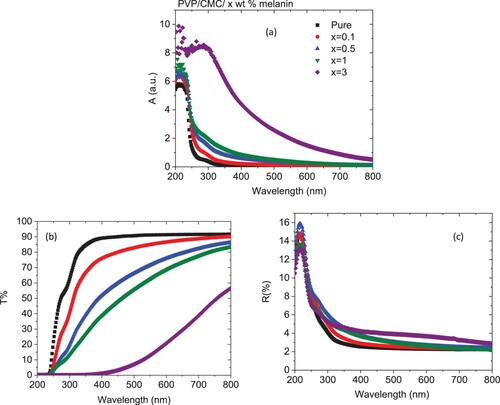
Figure 4. Tauc’ relation for (a) direct optical band gap for melanin powder, (b) direct and (c) indirect optical band gaps and (d, e) composition dependence of direct and indirect energy gaps for PVP/CMC/x wt% melanin polymers.
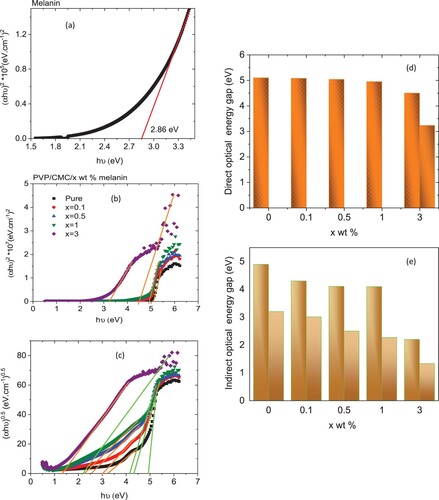
Figure 5. Changes of (a) extinction coefficient, (b) refractive index with the wavelength and (c) composition dependent of the refractive index at 500 nm for PVP/CMC/x wt% melanin polymers.
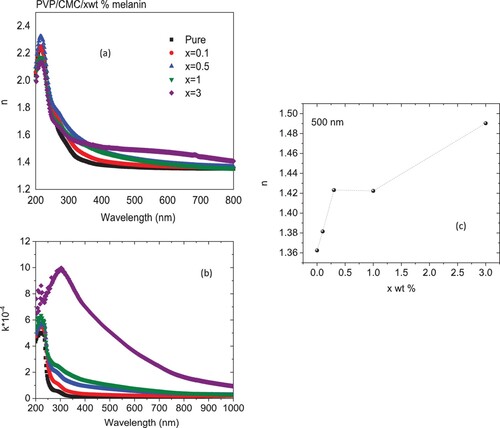
Figure 6. FL spectra for PVP/CMC/x wt% melanin polymers under different excitation wavelengths.
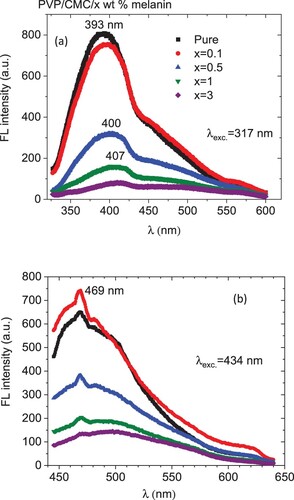
Figure 7. (a) Dielectric constant and (b) dielectric loss for PVP/CMC/x wt% melanin polymers.
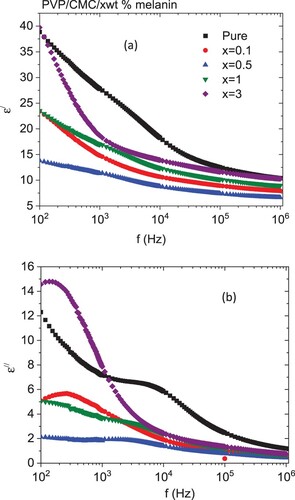
Figure 8. Variations of the AC electrical conductivity with frequency for PVP/CMC/x wt% melanin polymers.
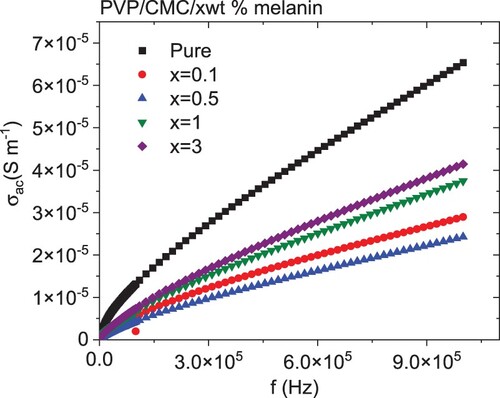
Figure 9. Variations of (a) real and (b) imaginary of the impedance with frequency for PVP/CMC/x wt% melanin polymers.
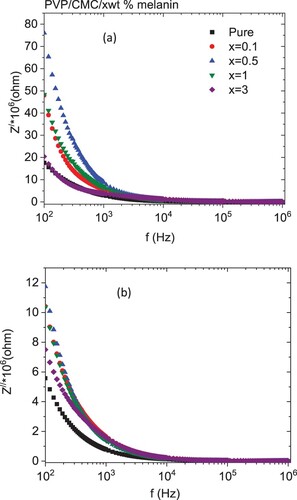
Figure 10. Nyquist plot for PVP/CMC/x wt% melanin polymers.
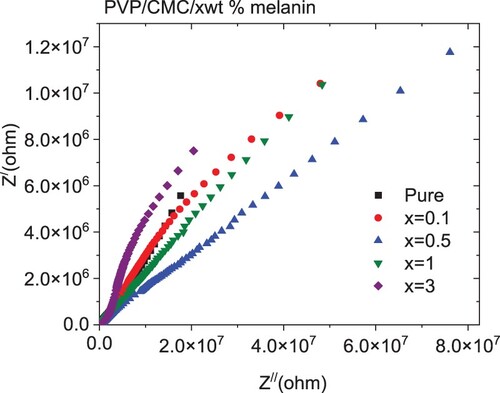
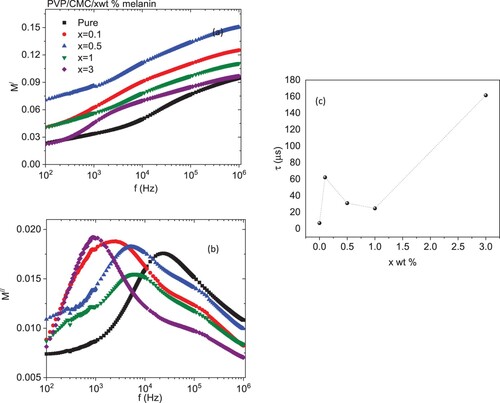
Figure 11. Variations of (a) real and (b) imaginary of electric modulus with frequency and (c) composition dependence of relaxation time for PVP/CMC/x wt% melanin polymers.
Research data policy and data availability statements
The authors confirm that the data supporting the findings of this study are available within the article [and/or] its supplementary materials.