Figures & data
Figure 1. IR spectrum analysis of Propolis extract.
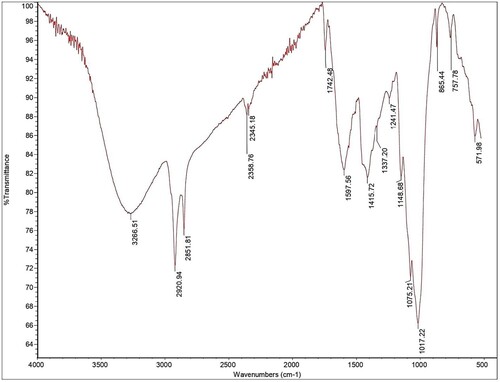
Table 1. FTIR spectrum analysis of Propolis extract.
Figure 2. Mean ± SD data of lung index between different study groups. *: Significance against the CON group, #: significance against the URT group. P < 0.05.
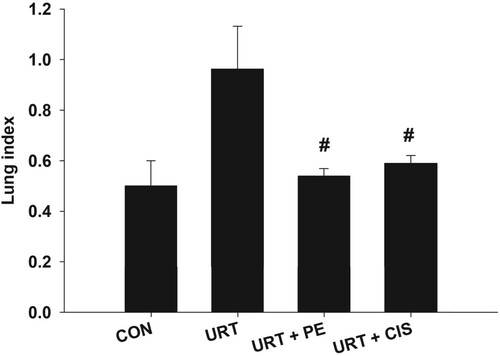
Figure 3. The transverse section in the lungs of the study groups (H&E stain). (A) The CON group shows normal lung histo-architecture; terminal bronchiole (TB), alveolar sac (AS), alveoli (A), thin inter-alveolar septum (black arrow) and thick interstitial tissue (red arrow). (B) The URT group showing papillary adenocarcinoma in the lumen of a terminal bronchiole (TB) formed of tumour mass (TM) of irregular papillae lined by hyperplastic columnar epithelial cells with basal vesicular nuclei (black arrow) with some pleomorphic cells differ in their shape and size (brown arrows). (C) The URT + PE-treated group shows terminal bronchiole (TB), alveolar sac (AS), variable-sized alveoli (A), thin inter-alveolar septum (black arrow), moderate thickened interstitial tissue (red arrow), some macrophages (MK) in the lung parenchyma. (D) The URT + CIS-treated group shows terminal bronchiole (TB), alveolar sac (AS), alveoli (A), thickened BV, peri-bronchial inflammation (PBI), RBCs extravasation (EV). Bar = 50 µm.
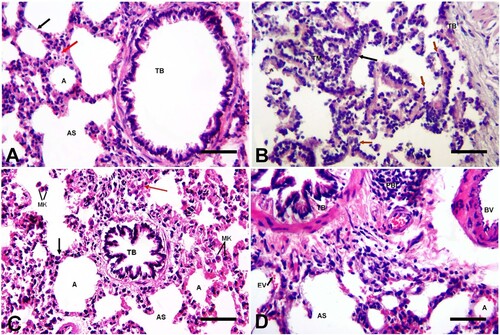
Figure 4. Semi-quantitative determinations of (A) the bronchiolar wall thickness, (B) alveolar lumen diameter and (C) inflammatory score in lungs of different study groups. Data represents Mean ± S.D.*: Significance against CON group, #: significance against URT group. P < 0.05.
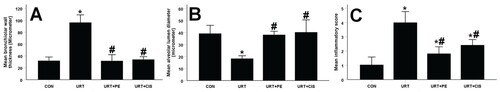
Figure 5. Mean ± SD quantitative analysis of area % of collagen fibres, AB-PAS positive Rx. and anti-PCNA positive immune Rx. in the lungs of different study groups. *Significance against the CON group, #significance against the URT group. P < 0.05.
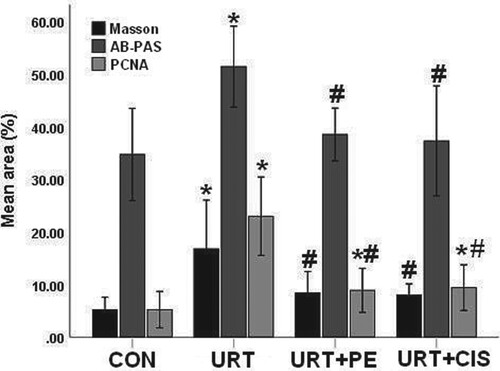
Figure 6. A transverse section in the lungs of different study groups (Masson trichrome stain). (A) The CON group shows a moderate amount of collagen fibres between lung alveoli (arrowhead) and around the terminal bronchiole, blood vessel (arrow), terminal bronchiole (TB), the bronchiolar epithelium (BE), smooth muscle fibres (MF), alveolar sac (AS), alveoli (A) and alveolar epithelium (AE). (B) The URT group shows an excessive amount of collagen fibres around and within the terminal bronchiole (TB) (arrows), terminal bronchiole (TB), the bronchial epithelium (BE) and disrupted layer of smooth muscle fibres (MF). (C) The URT + PE-treated rats group shows moderate collagen fibre deposited around terminal bronchiole (TB) (arrow) and in between alveoli (A) (arrowhead) (D) The URT + CIS-treated rats group shows moderate collagen fibre deposited around terminal bronchiole (TB) (arrow) and in between alveoli (A) (arrowhead), alveolar sac (AS), alveoli (A) and peribronchial inflammation (PBI). Bar = 50 µm.
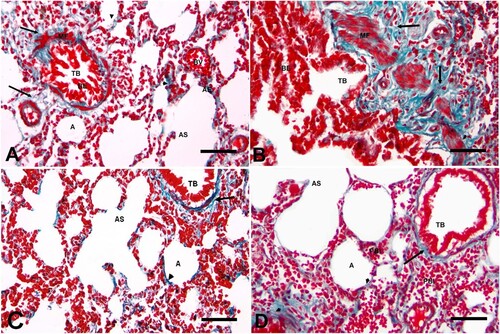
Figure 7. A transverse sections in the lungs of the study groups shows AB-PAS positive reactions. (A) The CON group shows moderate positive AB-PAS Rx. with moderate mucinous content, a black arrow (intense reaction area), a blue arrow (moderate reaction area). (B) The URT group shows a strong positive AB-PAS Rx. with excessive neutral mucins (black arrow) and acidic mucins (arrowhead), terminal bronchiole (TB), muscle fibre (MF) and bronchial epithelium (BE). (C) The URT + PE-treated group shows moderate positive AB-PAS reaction with moderate mucinous content, a black arrow (intense reaction area) and a blue arrow (moderate reaction area). (D) The URT + CIS-treated group shows moderate positive AB-PAS Rx. with moderate mucinous content. Bar = 50 µm.
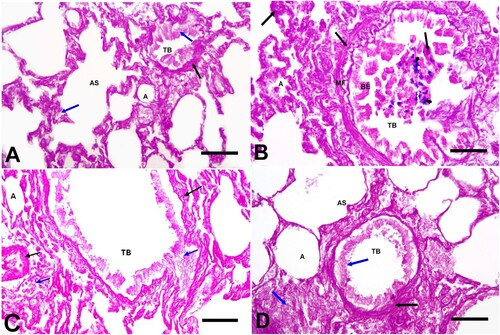
Figure 8. Transverse sections in the lungs of different study groups showing anti-PCNA positive Rx. in lung nuclei (A) The CON group shows general moderate PCNA positive immunoreaction where strong positive Rx. area (a black arrow), moderate positive Rx. area reaction (a blue arrow) and mild reaction positive Rx. area (a red arrow). (B) The URT group shows strong positive PCNA immunoreaction where a strong positive reaction area (black arrow) in bronchial epithelial cells (BE) of terminal bronchiole (TB), moderate positive Rx. the area around the terminal bronchiole (TB) and mild reaction positive Rx. area in the muscle fibre layer (MF) (a red arrow). (C) The URT + PE-treated group shows moderate positive PCNA immunoreaction where a strong reaction area (a black arrow) in alveolar cells, a moderate reaction in lining cells of a terminal bronchiole (TB) (a blue arrow) while a weak reaction in interstitial cells (a red arrow). (D) The URT + CIS-treated group shows a moderate positive PCNA immune reactivity where a strong reaction area around the terminal bronchiole (TB) (a black arrow), appeared in some interstitial cells, a moderate reaction in some alveolar cells (a blue arrow), while a weak reaction appeared in some bronchial lining cells (a red arrow). Bar = 50 µm.
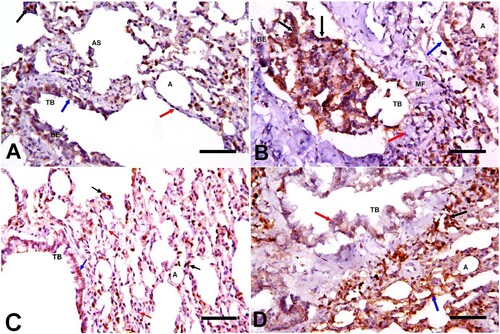
Figure 9. Transmission electron-micrograph of terminal bronchial Clara cells in the lungs of different study groups (Uranyl acetate & Lead citrate stain). (A) The CON group shows the bronchial epithelial lining of the terminal bronchiole comprising ciliated cells (Ci) and Clara cells (Cl). Clara cells formed and bulging apex protrude towards the bronchial lumen (L) and the main body. The apex contains smooth endoplasmic reticulum (sER), pale elongated mitochondria (M) and dense secretory granules (SG), while the main body contains a notched vesicular nucleus (N) and some (SG). Ciliated cells have cilia directed towards the airway lumen (a red arrow). (B) The URT group showing tumour mass (TM) of a closely packed group of pleomorphic cells with characteristic dense secretory granules (SG), pleomorphic nuclei and distorted cell boundaries. Ciliated cells have cilia directed towards the airway lumen (a red arrow). (C) The URT group shows a magnified part of Clara cells with pleomorphic nuclei (N) surrounded by pale cytoplasms, a few dense secretory granules (SG) and many ruptured smooth endoplasmic reticulums (sER). Cells do not rest on the basement membrane (a blue arrow) with underlying collagen fibres (an arrowhead). Ciliated cells have cilia directed towards the airway lumen (a red arrow). (D) The URT + PE-treated group shows almost restoration of the bronchial epithelial lining of the terminal bronchiole comprising ciliated cells (Ci) and Clara cells (Cl). Clara cells formed and bulging apex protrude towards the bronchial lumen (L) and the main body. The apex of Clara’s cell contains electron-dense secretory granules (SG) and mitochondria (M). The main body of Clara cell contains a vesicular basal central nucleus (N) surrounded by smooth endoplasmic reticulum (sER). The ciliated cell has cilia directed towards the lumen (a red arrow). (E) The URT + CIS-treated group shows more or less restoration of Clara cells (Cl) that protrude larger into the lumen (L). The apex of Clara cell contains some spherical mitochondria (M), electron-dense secretory granules (SG), dilated smooth endoplasmic reticulum (sER), while the main body contains a central round nucleus (N), vacuoles (V) and many (SG). Scale bar = 500 nm, except for Fig. C = 2 µm.
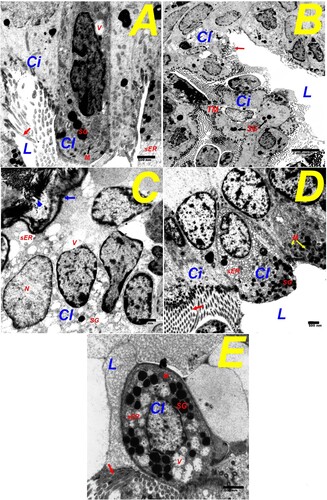
Table 2. Mean ± SD of GSH concentration, SOD activity, MDA content in the lungs of control (CON), Urethane (URT), Propolis-treated (URT + PE) and cisplatin-treated (URT + CIS) groups.
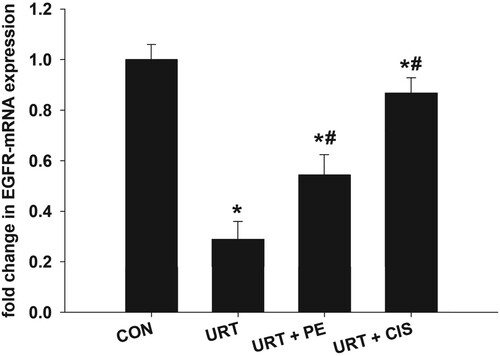
Figure 10. Quantitative RT-PCR analysis of relative fold change of EGFR m-RNA expression in the lungs of different study groups. Data expressed as Mean ± SD. *Significance against CON group, #: significance against URT group. P < 0.05.