
Figures & data

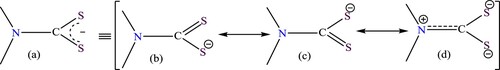
Figure 1. Resonance stabilization of the dithiocarbamate anions (a-c) and thiouride (d) tautomer.
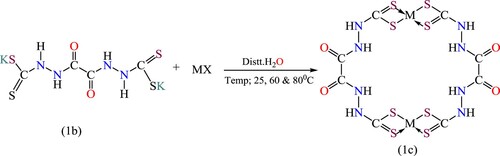
Scheme 1. Synthetic route of ligands synthesis K2L1 (1b), K2L2 (2b).
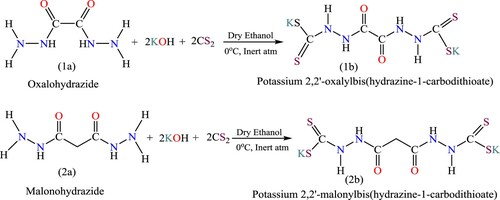
Figure 2. 13C NMR spectral representation of ligand K2L1 in deuterium oxide (D2O).
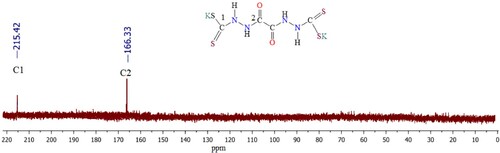
Figure 3. 1HNMR spectral representation of ligand K2L2 in deuterium oxide (D2O).
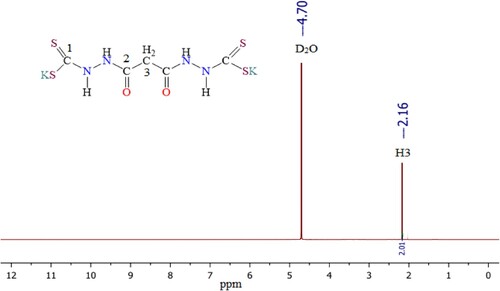
Figure 4. 13C NMR spectral representation of ligand K2L2 in deuterium oxide (D2O).
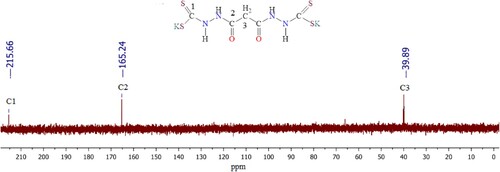
Table 1. Comparison of infrared spectral details of ligands and their complexes with the literature.
Scheme 2. The ligand-to-metal ratio in the complex formation of Ligand K2L1 (M=Fe, Co, Ni, Cu, Cd, Ag, Zn, and Pb) at various temperatures and pH (1c).
Scheme 3. The ligand-to-metal ratio in the complex formation of Ligand K2L2 (M=Fe, Co, Ni, Cu, Cd, Ag, Zn, and Pb) at various temperatures and pH (2c).
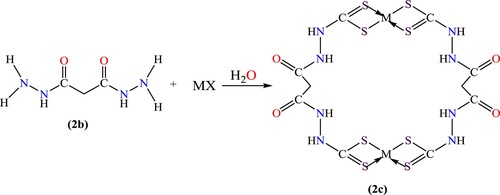
Figure 5. Determination of Ni ration to K2L1 ligand.
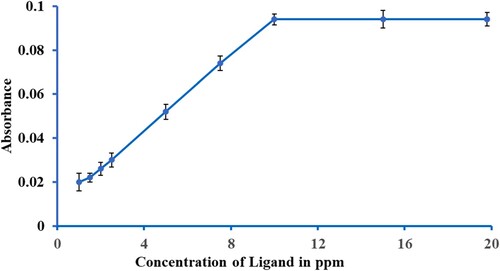
Figure 6. Determination of Zn ration to K2L2 ligand.
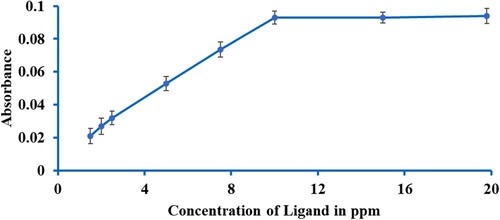
Table 2. Metal removal efficiency of dithiocarbamate ligands (K2L1-2) at various pH.
Figure 7. Representative IR spectrum of K2L1 and its NiL1 complexes.
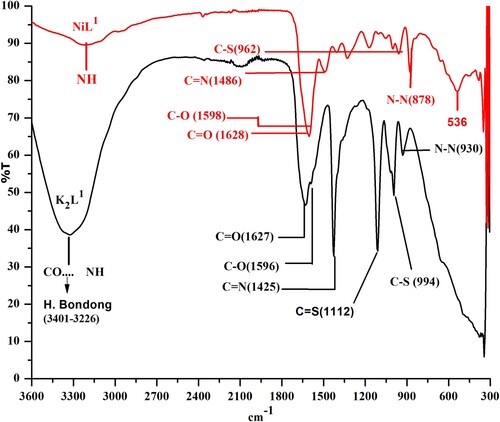
Figure 8. Representative IR spectrum of K2L1 and itsNiL1 complexes.
Table 3. Metal removal efficiency of dithiocarbamate ligands (K2L1-2) at various temp (°C).