Figures & data
Figure 1. Ag NPs TEM micrograph.
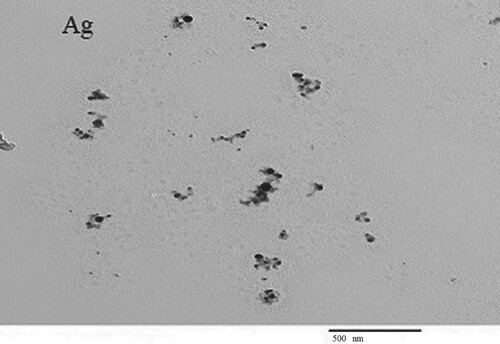
Figure 2. The absorbance spectra of the treated and non-treated CPVC/Ag films.
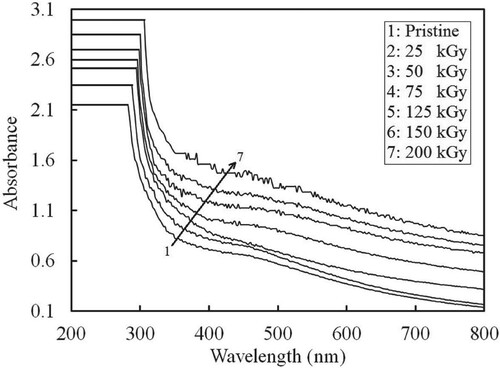
Figure 3. A plot of (αhν)2 versus hν for the treated and non-treated CPVC/Ag films.
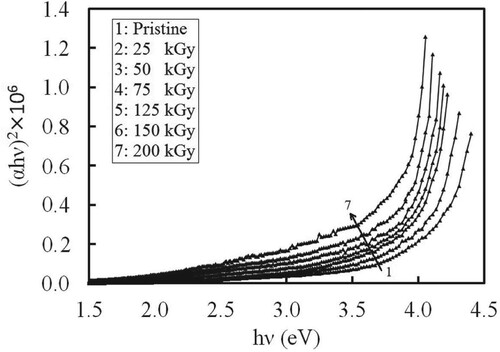
Figure 4. A plot of (αhν)0.5 versus hν for the treated and non-treated CPVC/Ag films.
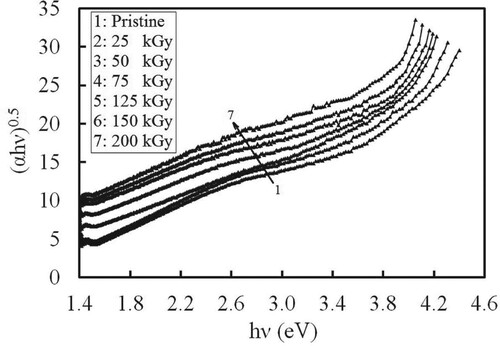
Figure 5. A plot of (αhν)2/3 versus hν for the treated and non-treated CPVC/Ag films.
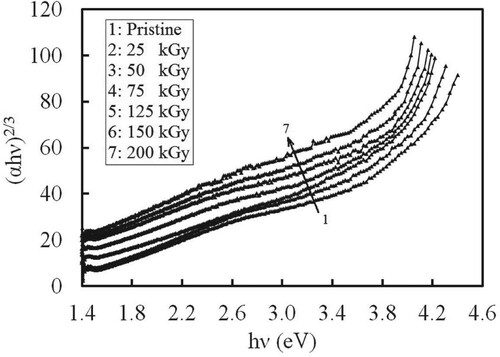
Figure 6. Eg and Eu variation with gamma dosage.
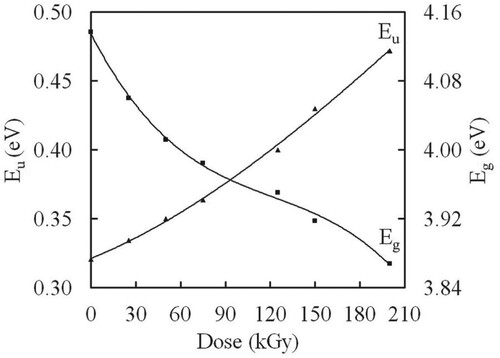
Figure 7. A plot of optical dielectric loss versus hν for the treated and non-treated CPVC/Ag films.
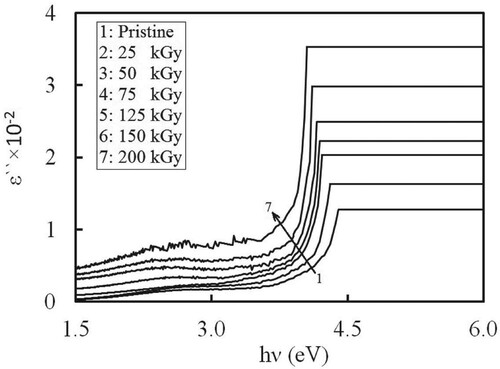
Table 1. Eg (from ε″ and Tauc’s model versus hυ) calculated for the non-treated and treated CPVC/NCP films
Figure 8. The refractive index spectra for the treated and non-treated CPVC/Ag films.
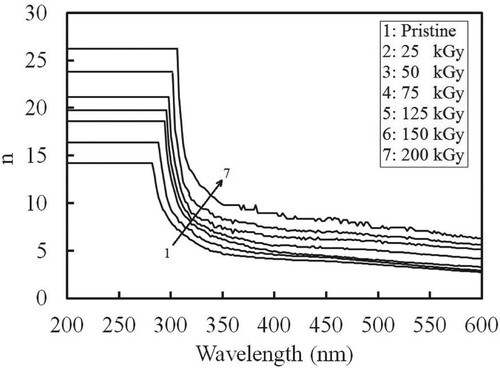
Figure 9. A plot of optical dielectric constant versus hν for the treated and non-treated CPVC/Ag films.
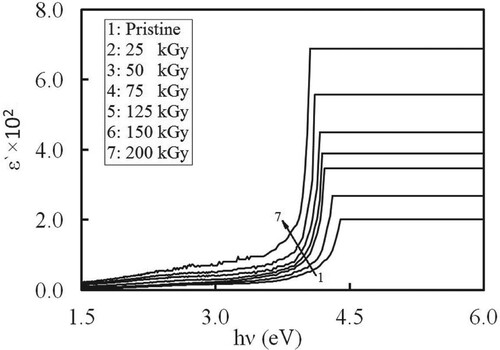
Figure 10. The transmission spectra for the treated and non-treated CPVC/Ag films.
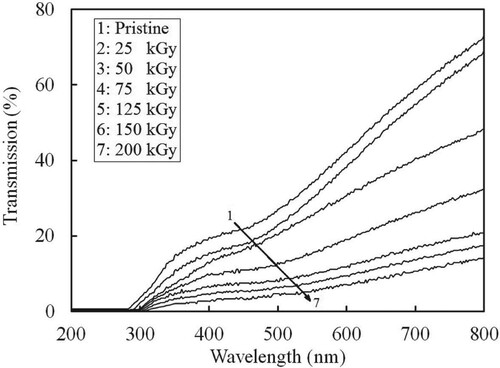
Table 2. The chromaticity coordinates and tristimulus values for CPVC/NCP films as a function of gamma dosage.
Figure 11. Color intercepts variation with gamma dosage.
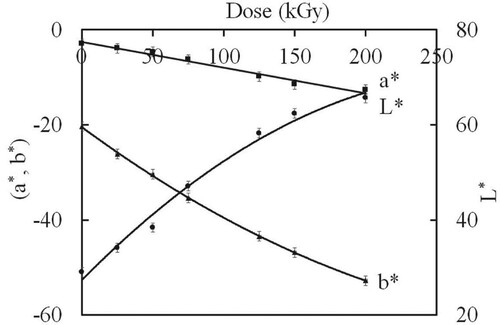
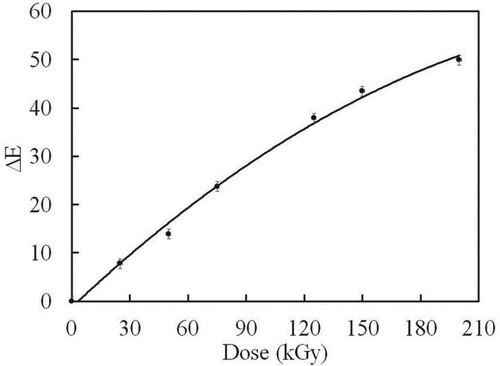
Figure 12. Color intensity variation with gamma dosage.