Figures & data
Figure 1. Geopolymerization (a) process and (b) sequence
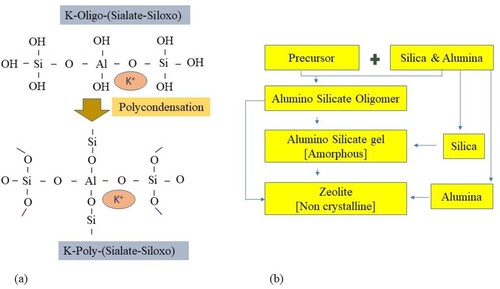
Table 1. Soil properties.
Figure 2. SEM images (a) FA and (b) S.
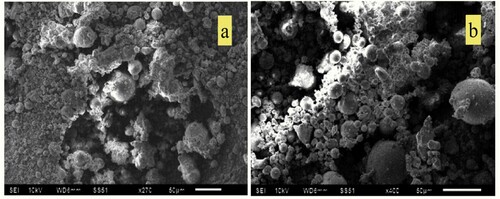
Figure 3. Sample preparation and testing.
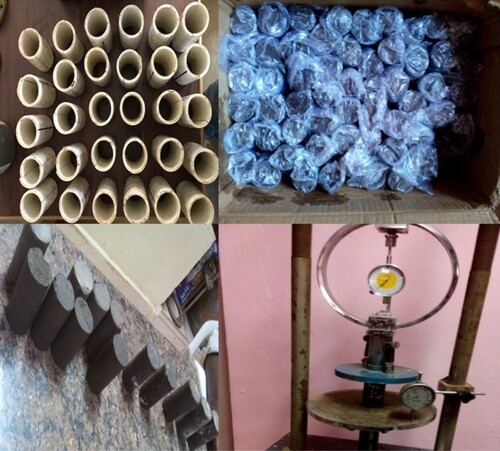
Figure 4. Heat map.
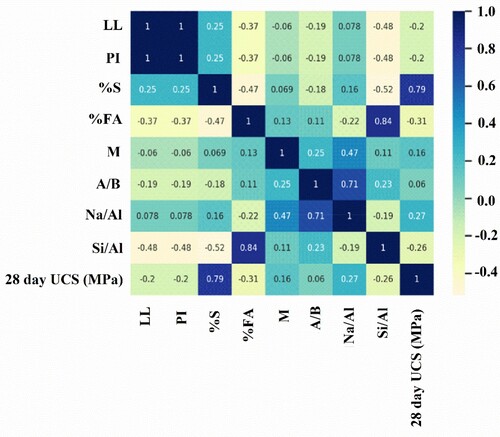
Figure 5. Structure of the RF model.
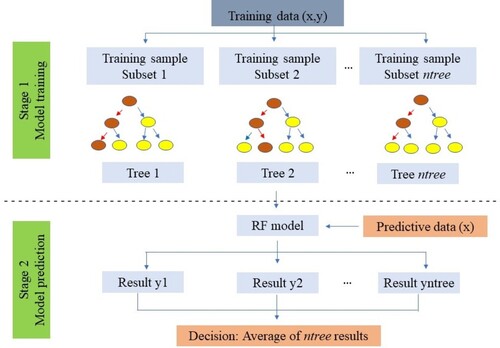
Figure 6. Hyperparameters tunning.
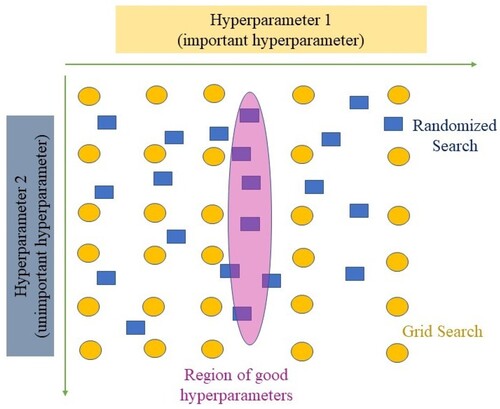
Table 2. Compaction results of the stabilized expansive clays.
Figure 7. Cement-treated clays stress–strain curves.
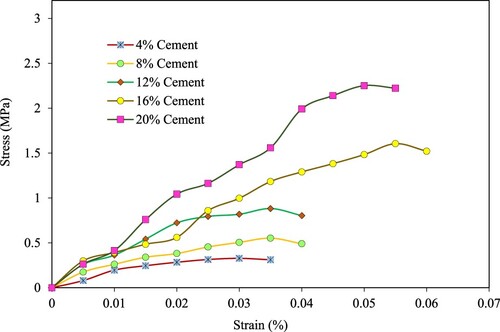
Table 3. UCS results of the stabilized expansive clays.
Figure 8. Fly ash-based geopolymer blended clays stress–strain curves.
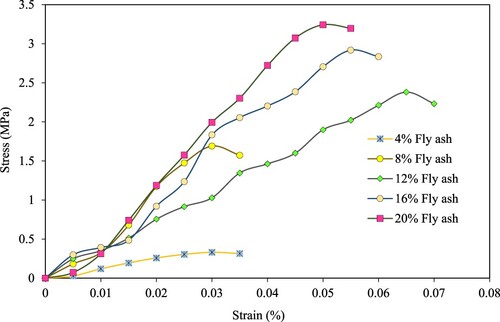
Figure 9. Slag-based geopolymer blended clays stress–strain curves.
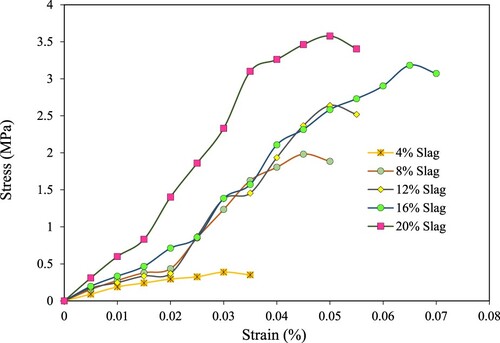
Figure 10. The effect of precursor content on UCS 28 days curing.
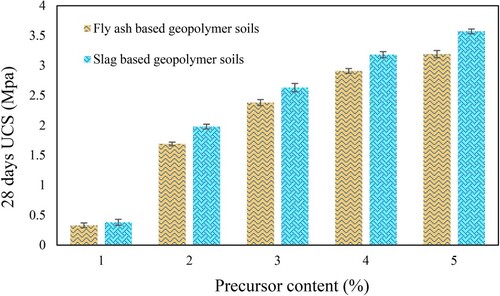
Figure 11. SEM images of the geopolymer soils blended with FA and S: (a) 8% FA, (b) 8% S, (c) 16% FA, (d) 16% S and (e) 20% S.
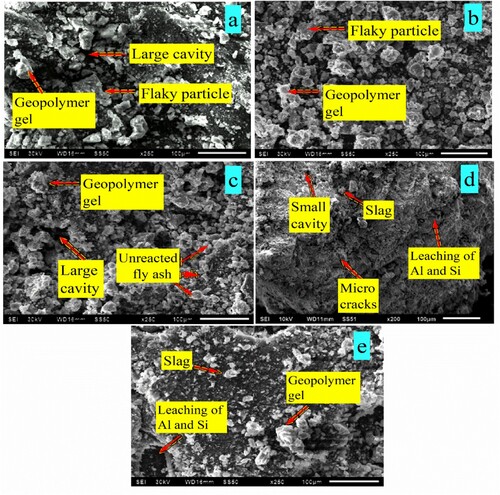
Table 4. Sustainability indices comparison of stabilized clays with OPC, fly ash-based geopolymers and slag-based geopolymers.
Figure 12. CO2 emissions of stabilized clays with (a) OPC, (b) fly ash-based geopolymers and (c) slag-based geopolymers.
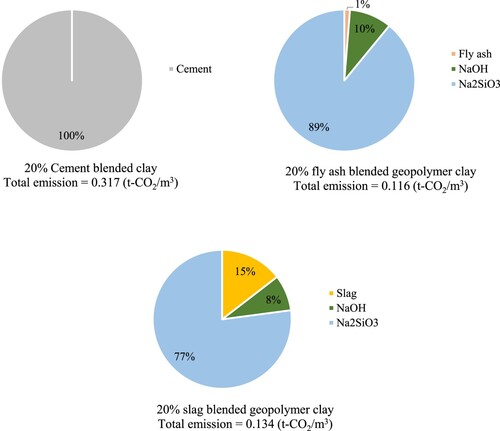
Figure 13. UCS prediction with LR (a) training and (b) testing.
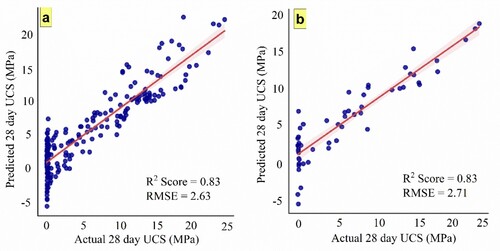
Table 5. Performance metrics comparison of various models.
Figure 14. UCS prediction with RF (a) training and (b) testing.
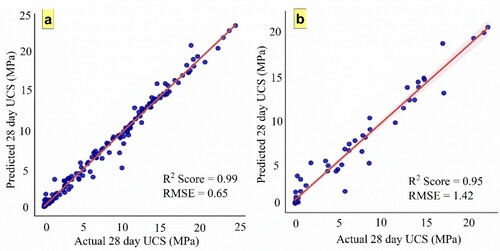
Figure 15. UCS prediction with BRRF (a) training and (b) testing.
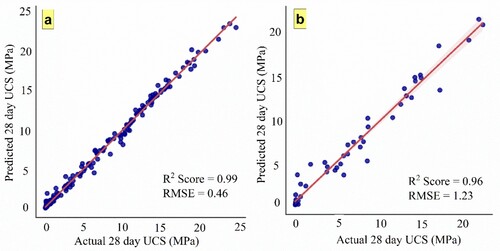
Figure 16. UCS prediction with BGRF (a) training (b) testing
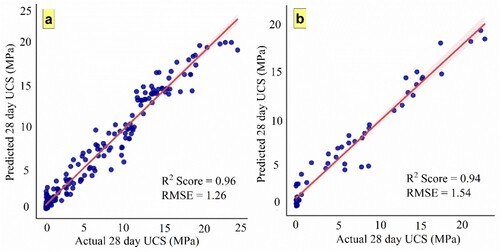
Figure 17. UCS prediction with KNN (a) training and (b) testing.
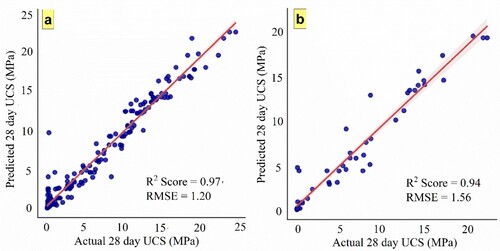
Figure 18. Performance (MAE) comparison of the models.
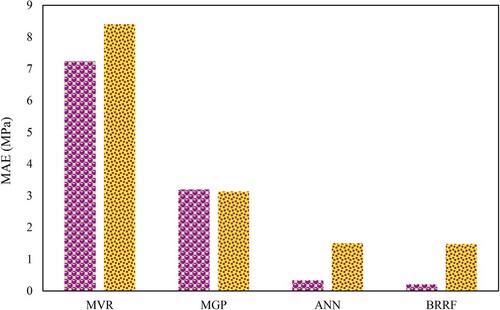
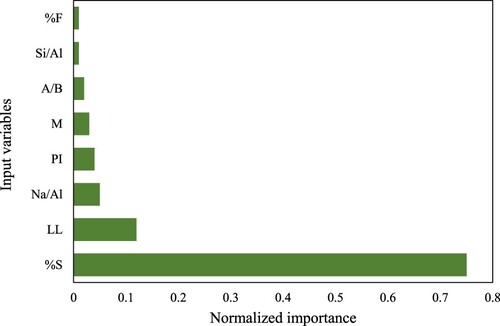
Figure 19. Variable factor importance for the RF regression model.