Figures & data
Figure 1. Schematic diagram of soil sampling points.
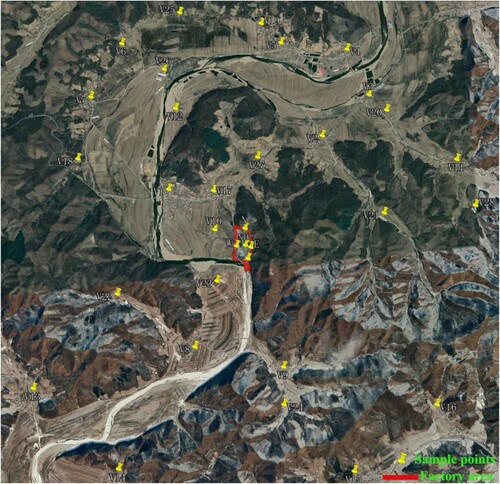
Table 1. Specific activities of 238U, 232Th, 226Ra and 40K in soil samples.
Table 2. Comparison of average specific activities in soils in the study area with those reported by other researchers in different countries.
Figure 2. Geo-Spatial distribution of 238U in the soils of the study area.
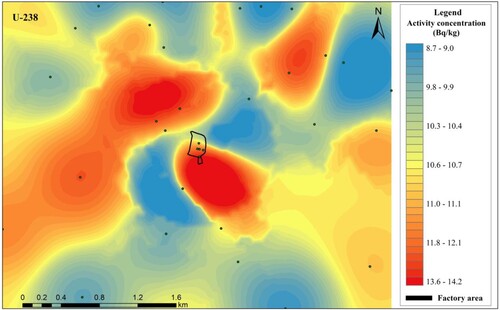
Figure 3. Geo-Spatial distribution of 232Th in the soils of the study area.
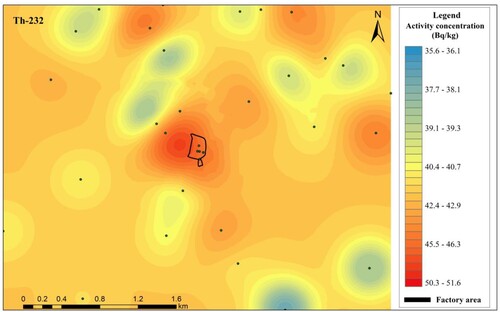
Figure 4. Geo-Spatial distribution of 226Ra in the soils of the study area.
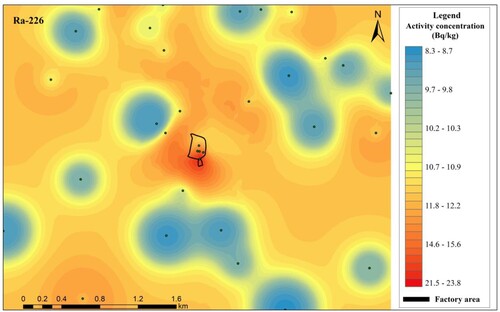
Figure 5. Geo-Spatial distribution of 40K in the soils of the study area.
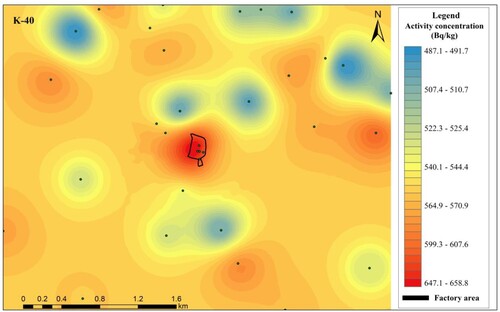
Table 3. Radiation hazard indicators in soil samples.
Table 4. Descriptive statistics of activity concentration of 238U, 232Th, 226Ra and 40K in soil samples.
Figure 6. Box plots of the results on 238U, 232Th, 226Ra and 40K activity concentrations in the soil samples.
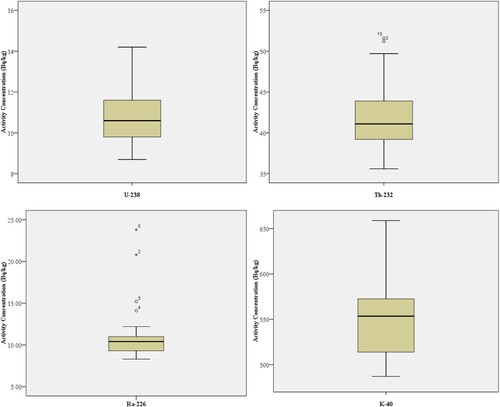
Figure 7. Frequency distribution and Quantile-quantile (Q-Q) plots of the activity concentrations for 238U of the investigated soil samples.
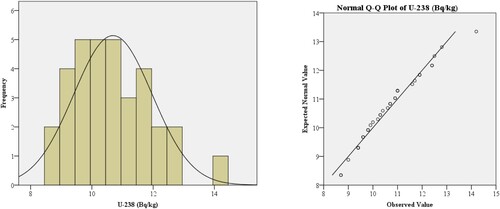
Figure 8. Frequency distribution and Quantile-quantile (Q-Q) plots of the activity concentrations for 232Th of the investigated soil samples.
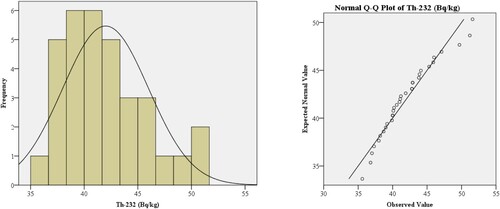
Figure 9. Frequency distribution and Quantile-quantile (Q-Q) plots of the activity concentrations for 226Ra of the investigated soil samples.
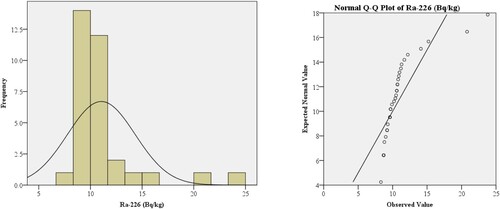
Figure 10. Frequency distribution and Quantile-quantile (Q-Q) plots of the activity concentrations for 40K of the investigated soil samples.
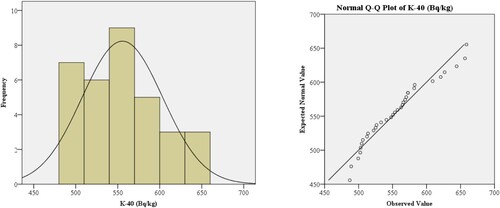
Table 5. Pearson’s correlation matrix between radioactive variables of the investigated soil samples.
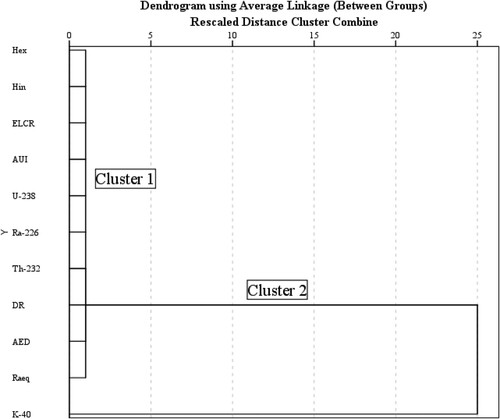
Figure 11. Dendrogram shows the clustering of radiological parameters.