
Figures & data
Figure 1. Physical model of the problem.
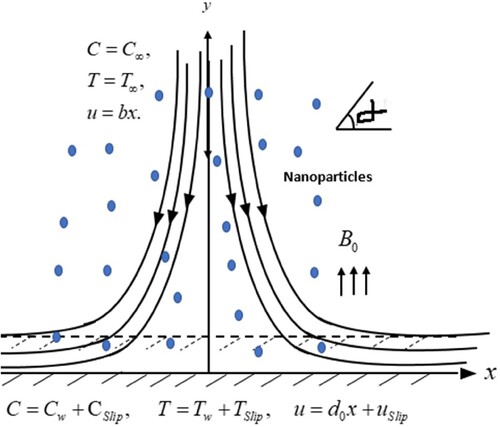
Figure 2. on
and
.
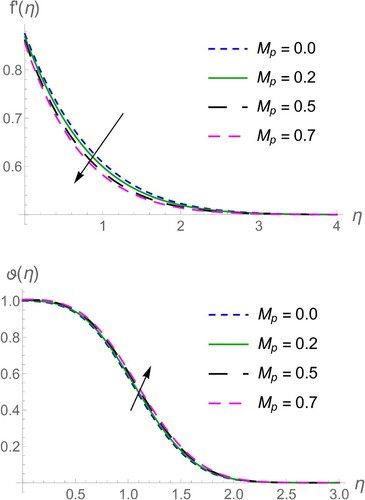
Figure 3. on
and
.
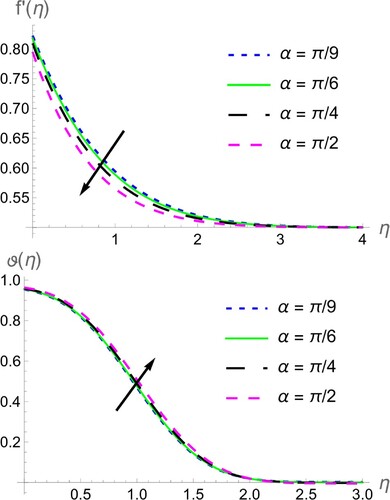
Figure 4. on
and
and
.
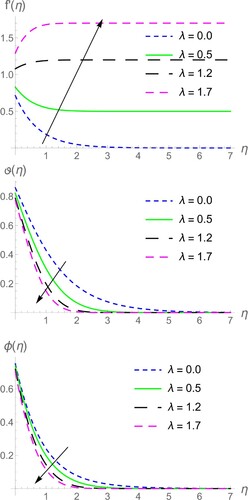
Figure 5. Darcy number on
and
.
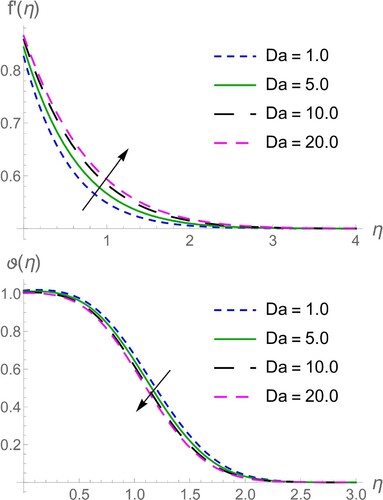
Figure 6. Chemical reaction parameter on
and
.
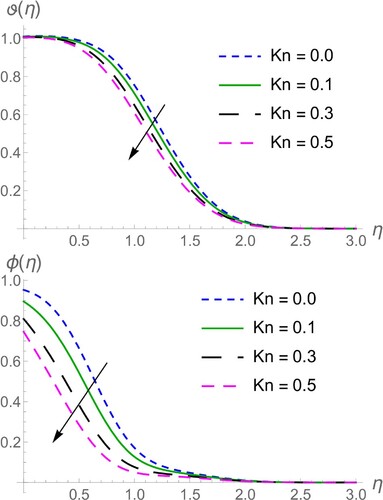
Figure 7. on
and
.
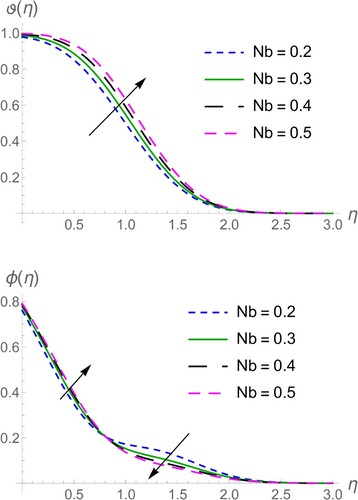
Figure 8. on
and
.
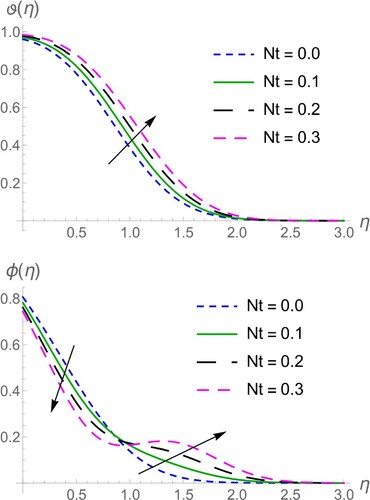
Figure 9. Velocity slip and thermal slip
on
and
.
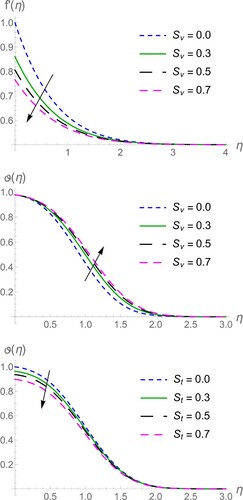
Figure 10. Solutal slip on
and
.
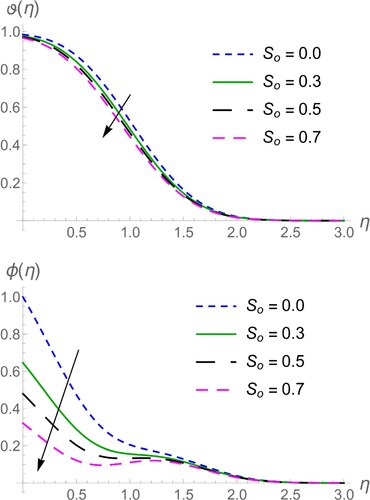
Table 1. ,
and
for constant values
,
,
,
and variation of other flow parameters.
Table 2. Comparison of and
with
by setting
and
.
Table 3. Residual error analysis of the respective momentum, energy and concentration distribution for the define data ,
,
,
,
,
,
,
,
,
,
,
,
,
,
,
, and
.