Figures & data

Figure 1. Structure of hirsutidin.
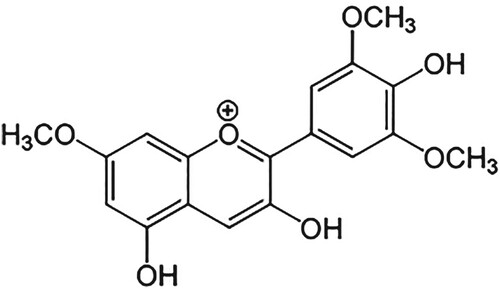
Figure 2. (A–D) Effect of hirsutidin on [A] Albumin, [B] Blood urea nitrogen (BUN), [C] Creatinin and [D] Direct bilirubin in EtOH-induced mice. #P < 0.001 vs normal, *P < 0.05, **P < 0.001 and ***P < 0.0001 vs EtOH.
![Figure 2. (A–D) Effect of hirsutidin on [A] Albumin, [B] Blood urea nitrogen (BUN), [C] Creatinin and [D] Direct bilirubin in EtOH-induced mice. #P < 0.001 vs normal, *P < 0.05, **P < 0.001 and ***P < 0.0001 vs EtOH.](/cms/asset/1161c0f8-66e3-438b-bd4f-efa19c155319/tusc_a_2301131_f0002_ob.jpg)
Figure 3. (A–C) Effect of hirsutidin on [A] Aspartate aminotransferase (AST), [B] Alanine aminotransferase (ALT) and [C] Alkaline phosphatase (ALP) in EtOH-induced mice. #P < 0.001 vs normal, *P < 0.05, **P < 0.01 and ***P < 0.001 vs EtOH.
![Figure 3. (A–C) Effect of hirsutidin on [A] Aspartate aminotransferase (AST), [B] Alanine aminotransferase (ALT) and [C] Alkaline phosphatase (ALP) in EtOH-induced mice. #P < 0.001 vs normal, *P < 0.05, **P < 0.01 and ***P < 0.001 vs EtOH.](/cms/asset/2c405574-8e09-4730-a1b4-1f4d6254ec47/tusc_a_2301131_f0003_ob.jpg)
Figure 4. (A–C) Effect of hirsutidin on [A] Triglyceride (TG), [B] Total cholesterol (TC), and [C] High density lipoprotein (HDL) in EtOH-induced mice. #P < 0.001 vs normal, *P < 0.05, **P < 0.001 and ***P < 0.0001 vs EtOH.
![Figure 4. (A–C) Effect of hirsutidin on [A] Triglyceride (TG), [B] Total cholesterol (TC), and [C] High density lipoprotein (HDL) in EtOH-induced mice. #P < 0.001 vs normal, *P < 0.05, **P < 0.001 and ***P < 0.0001 vs EtOH.](/cms/asset/3570b0d9-2b43-452f-8f36-9171d3ecc097/tusc_a_2301131_f0004_ob.jpg)
Figure 5. (A–C) Effect of hirsutidin on [A] Interlukins-1β (IL-1β), [B] IL-6 and [C] IL-12 in EtOH-induced mice. #P < 0.001 vs normal, *P < 0.05, **P < 0.001 and ***P < 0.0001 vs EtOH.
![Figure 5. (A–C) Effect of hirsutidin on [A] Interlukins-1β (IL-1β), [B] IL-6 and [C] IL-12 in EtOH-induced mice. #P < 0.001 vs normal, *P < 0.05, **P < 0.001 and ***P < 0.0001 vs EtOH.](/cms/asset/2d9e7ee4-aec9-496c-958c-2bed3d14004a/tusc_a_2301131_f0005_ob.jpg)
Figure 6. (A–B) Effect of hirsutidin on [A] Tumor necrosis factor-α (TNF-α) and [B] Interferon-gamma (IFN-γ) in EtOH-induced mice. #P < 0.001 vs normal, *P < 0.05, **P < 0.001 and ***P < 0.0001 vs EtOH.
![Figure 6. (A–B) Effect of hirsutidin on [A] Tumor necrosis factor-α (TNF-α) and [B] Interferon-gamma (IFN-γ) in EtOH-induced mice. #P < 0.001 vs normal, *P < 0.05, **P < 0.001 and ***P < 0.0001 vs EtOH.](/cms/asset/cfa01aa1-6fca-47d6-9da8-e90d531a2a92/tusc_a_2301131_f0006_ob.jpg)
Figure 7. (A–C) Effect of hirsutidin on [A] Superoxide dismutase (SOD), [B] Glutathione (GSH) and [C] Catalase (CAT) in EtOH-induced mice. #P < 0.001 vs normal, *P < 0.05 and **P < 0.001 vs EtOH.
![Figure 7. (A–C) Effect of hirsutidin on [A] Superoxide dismutase (SOD), [B] Glutathione (GSH) and [C] Catalase (CAT) in EtOH-induced mice. #P < 0.001 vs normal, *P < 0.05 and **P < 0.001 vs EtOH.](/cms/asset/1307c4e8-bd07-4a6c-872e-aae3c5b53ed2/tusc_a_2301131_f0007_ob.jpg)
Figure 8. Effect of hirsutidin on malondialdehyde (MDA) in EtOH-induced mice. #P < 0.001 vs normal and *P < 0.05 vs EtOH.
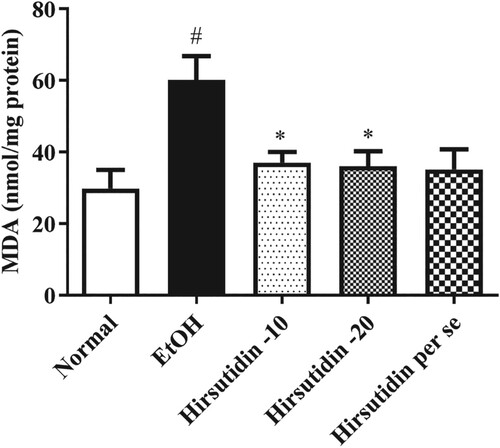
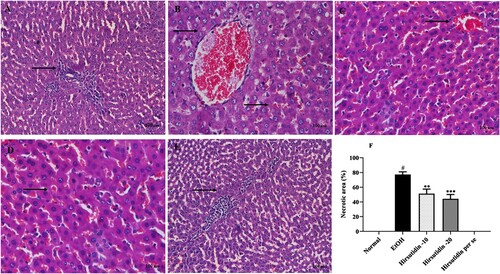
Figure 9. (A–E) Effect of hirsutidin on histological changes in all the groups. Liver sections stained with hematoxylin and eosin (H&E X200, scale bar = 100 μm). A. Normal group, normal architecture indicated by black arrow B. Ethanol control group, severe degenerative to necrotic lesions indicatd by black arrow, C. hirsutidin (10 mg/kg) minor abnormalities indicated by black arrow, D. hirsutidin (20 mg/kg) restored to normal indicated by black arrow, E. hirsutidin Per se, normal architecture indicated by black arrow F. The percentage of necrotic area in mice liver samples, #P < 0.001 vs normal and **P < 0.001, ***P < 0.0001 vs EtOH.