Figures & data

Figure 1. XRD patterns of NiO, In2O3, and NiO-In2O3 composite displaying characteristic diffraction peaks.
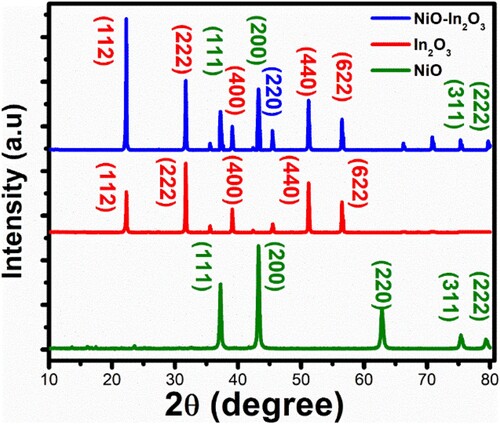
Figure 2. FTIR spectra of NiO, In2O3, and NiO-In2O3 nanomaterials showing characteristics of IR vibrational bands.
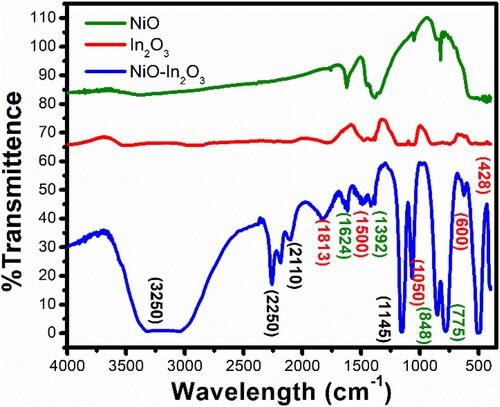
Figure 3. The FE-SEM Micrograph of (a) NiO nanoparticles, (b) In2O3 nanoplates and (c) NiO-In2O3 nanocomposite, (d & e) EDX analysis of NiO-In2O3 nanocomposite and corresponding SEM micrograph, representing good atomic ratios with significant intensities of Ni and In.
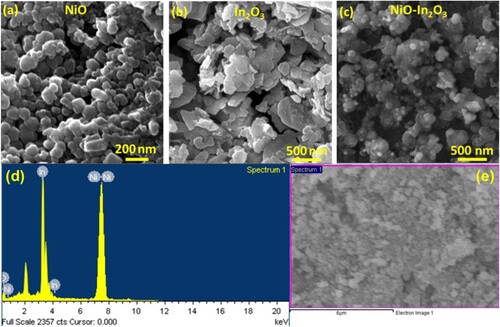
Figure 4. (a & b) Low and high-resolution TEM micrographs of NiO-In2O3 nanocomposites (c) Fringe spacing of polycrystalline NiO-In2O3 nanocomposites (d) SAED pattern of NiO-In2O3 nanocomposites.
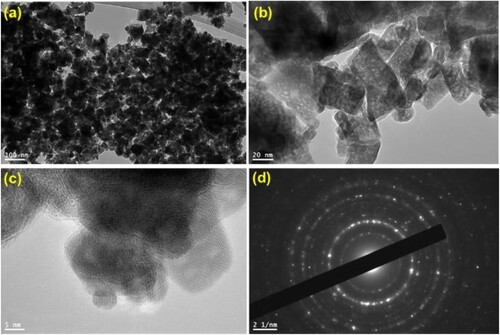
Figure 5. (a) CV scan for NiO, In2O3, and NiO-In2O3 in 1 M H2O2 (b) CV scan for NiO, In2O3 and NiO-In2O3 in 1 M ascorbic acid (c) CV scan for NiO, In2O3, and NiO-In2O3 in 1 M Ethanol (d) CV scan for NiO-In2O3 in 1 M M H2O2, ethanol and ascorbic acid. All CV scans showed enhanced electrocatalytic performance and OER via NiO-In2O3.
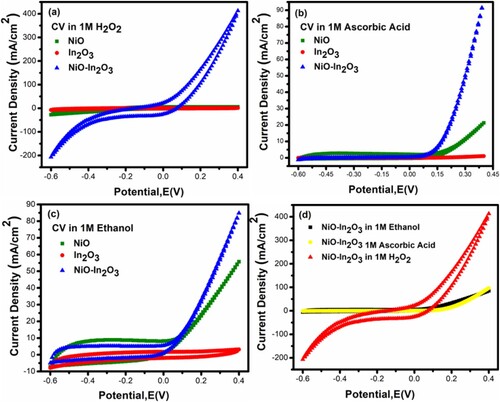
Figure 6. (a) LSV for NiO, In2O3 and NiO-In2O3 in 1 M H2O2 (b) LSV for NiO, In2O3 and NiO-In2O3 in 1 M ascorbic acid (c) LSV for NiO, In2O3 and NiO-In2O3 in 1 M ethanol (d) LSV for NiO-In2O3 in 1 M H2O2, ascorbic acid and ethanol.
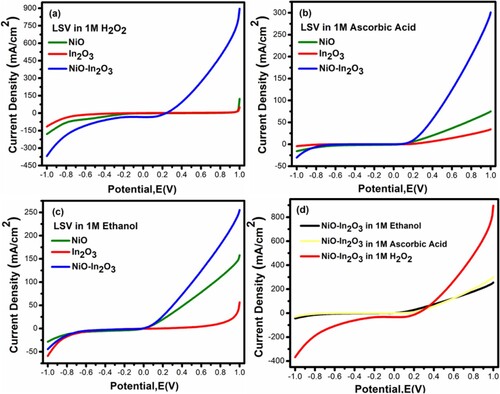
Figure 7. (a) Polarization curves (LSV) for NiO, In2O3, and NiO-In2O3 in 1 M H2O2 (b) Tafel plot used for estimation of Tafel slope for NiO, In2O3, and NiO-In2O3 in 1 M ascorbic acid (c) Decade current density recorded for NiO, In2O3, and NiO-In2O3 in 1 M H2O2 (d) Peak current density recorded for NiO-In2O3 NiO, In2O3, and NiO-In2O3 in 1 M H2O2.
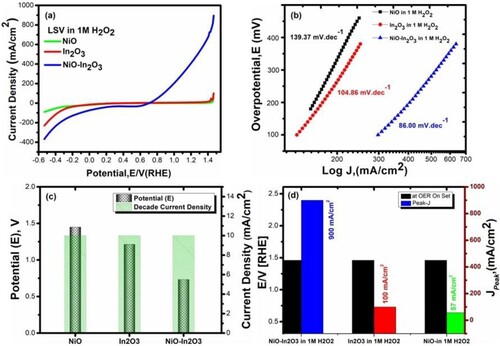
Figure 8. (a) Impedance spectroscopy analysis (Nyquist Plot) of NiO, In2O3 and NiO-In2O3 in 1 M ascorbic acid (b) Impedance spectroscopy analysis (Nyquist Plot) of NiO, In2O3 and NiO-In2O3 in 1 M ethanol (c) Impedance spectroscopy analysis (Nyquist Plot) of NiO, In2O3 and NiO-In2O3 in 1 M H2O2 (d) Impedance spectroscopy analysis (Nyquist Plot) of NiO-In2O3 in different concentration of H2O2.
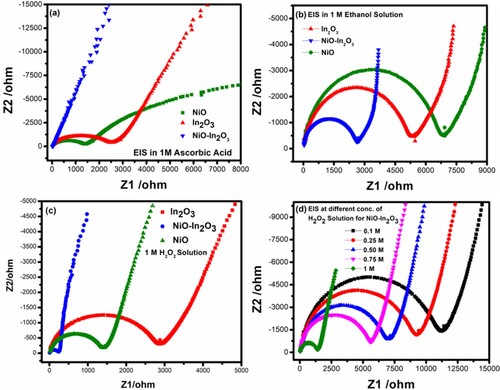
Figure 9. (a) Plot of charge transfer resistance vs exchange current density for NiO, In2O3 and NiO-In2O3 in 1 M 1 M H2O2 (b) Over potential vs Peak current density of NiO, In2O3 and NiO-In2O3 in 1 M H2O2 (c) Current density vs Potential in RHE and (d) Turn over frequency vs potential in RHE estimated for NiO, In2O3 and NiO-In2O3 in 1 M H2O2.
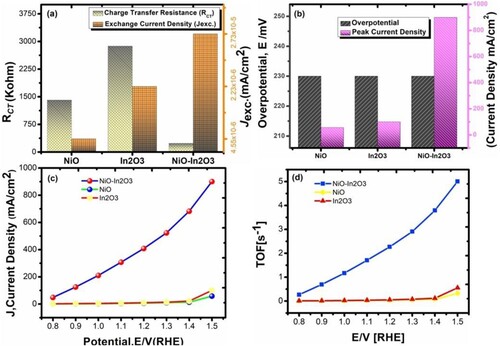
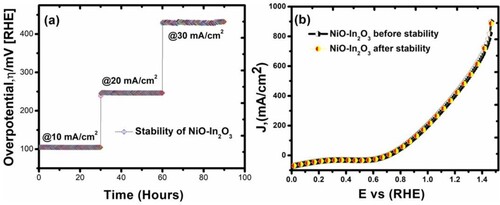
Figure 10. (a) Chronopotentiometry response of NiO-In2O3 in 1 M H2O2 prepared hydrothermally. The CP profiles show enhanced overpotential and long-term durability of NiO-In2O3 10, 20, and 30 mA cm−2 beyond >90 h. (b) LSV polarization curves for NiO-In2O3 before and after the durability test show a similar current density profile for the entire potential.