
Figures & data
Figure 1. Graphene mechanical and electrical properties.
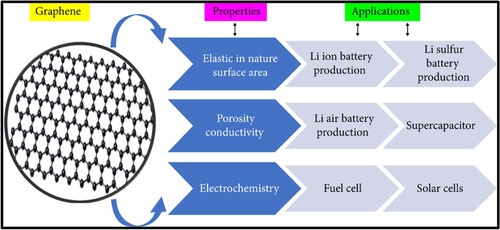
Figure 2. XRD pattern of (a) GO, (b) AlCrO3 and (c) GO@AlCrO3@SiO2@Mn3O4@SnO2 nanocomposite.
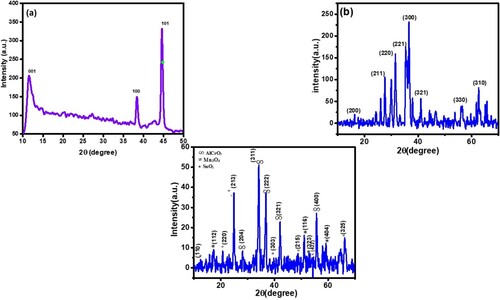
Table 1. Lattice parameters, particle, crystalline size and strain values of compound.
Figure 3. WH plot curves of (a) AlCrO3 and (b) GO@AlCrO3@SiO2@Mn3O4 nanocomposite.
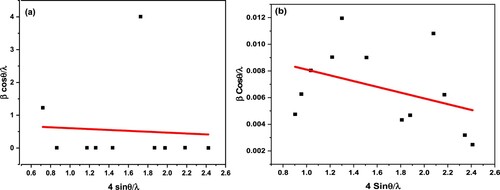
Table 2. Miller indices and peak lists of AlCrO3 and GO/AlCrO3/SiO2/Mn3O4/SnO2 nanocomposite.
Figure 4. SEM images of (a) GO (b) GO@AlCrO3@SiO2@Mn3O4@SnO2 (c) AlCrO3.
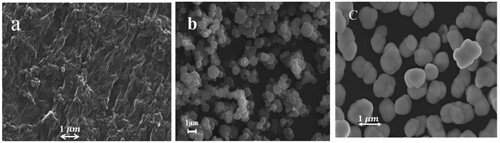
Figure 5. Grains diameter variation and Histogram distribution of GO@AlCrO3@SiO2@Mn3O4@SnO2 nanocomposite.
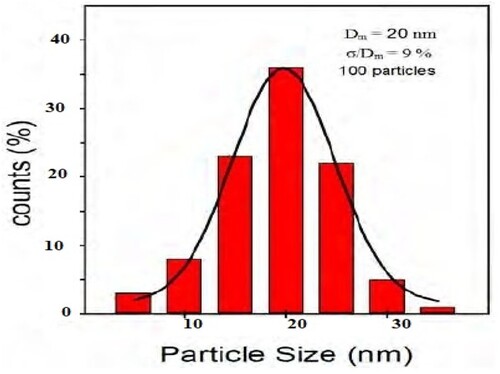
Figure 6. FTIR spectra of (a) GO@AlCrO3@SiO2@Mn3O4@SnO2 (b) GO (c) Mn3O4 and (d) AlCrO3.
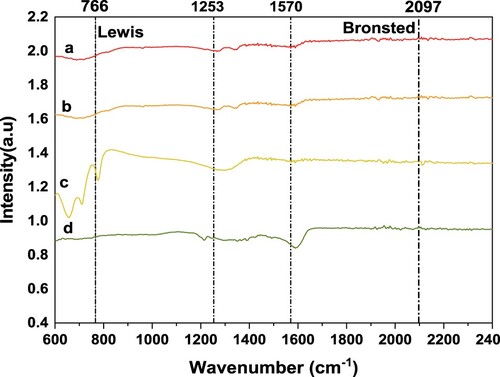
Figure 7. EDs spot and spectra of AlCrO3.
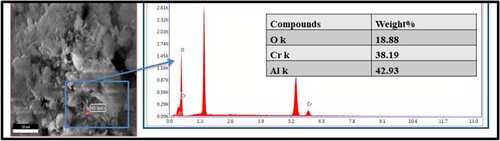
Figure 8. Energy dispersive spot and spectra of GO@AlCrO3@SiO2@Mn3O4@SnO2 nanocomposite.
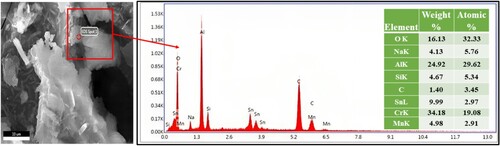
Figure 9. Raman spectra of (a) GO and (b) GO@AlCrO3@SiO2@Mn3O4@SnO2 nanocomposite.
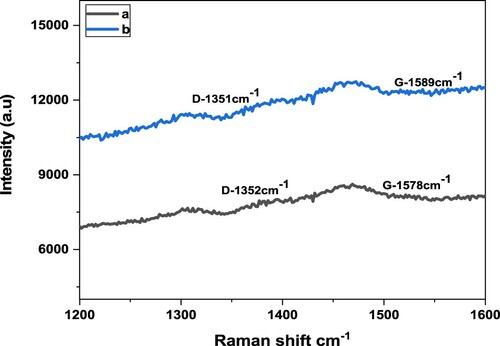
Figure 10. Band Gap of GO@AlCrO3@SiO2@Mn3O4@SnO2 nanocomposite.
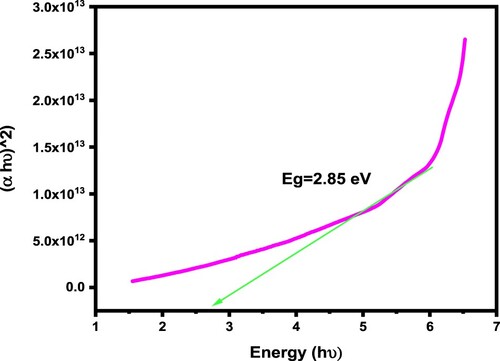
Figure 11. Zeta potential of GO@AlCrO3@SiO2@Mn3O4@SnO2 nanocomposite.
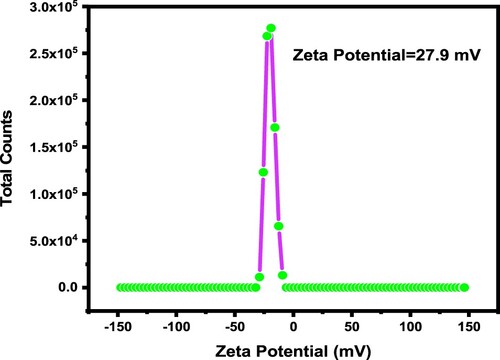
Figure 12. Cyclic voltammetry at various scan rates GO@AlCrO3@SiO2@Mn3O4@SnO2 nanocomposite.
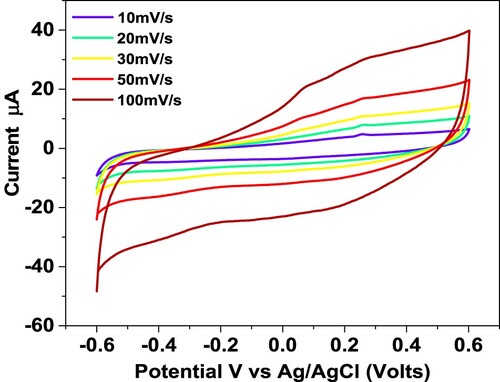
Figure 13. The specific capacitance of nanocomposite at various scan rates.
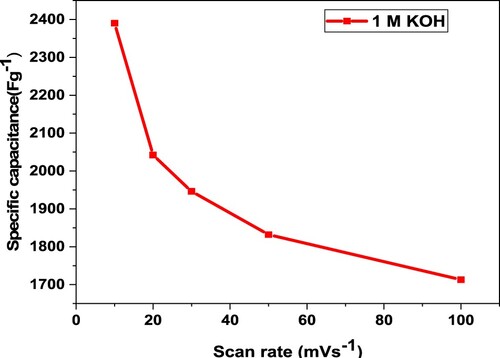
Table 3. Measurements of specific capacitance of GO@AlCrO3@SiO2@Mn3O4@SnO2 at various scan rates.
Figure 14. (a) GCD curves and Ragone plot of GO@AlCrO3@SiO2@Mn3O4@SnO2 nanocomposite in IM KOH electrolyte (b) Cycling performance.
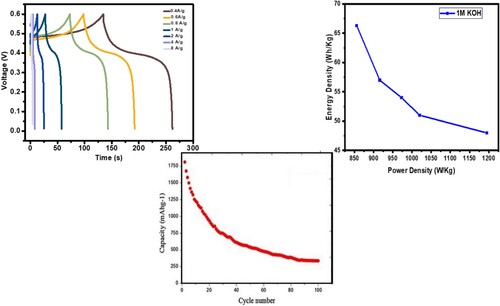
Figure 15. EIS spectra of GO@AlCrO3@SiO2@Mn3O4@SnO2 nanocomposite in IM KOH electrolyte solution.
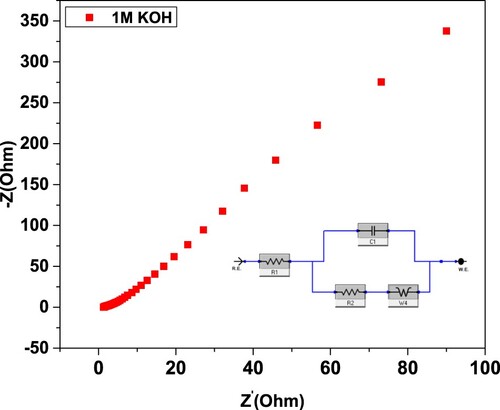
Table 4. GO@AlCrO3@SiO2@Mn3O4@SnO2 nanocomposite electrode material parameters.
Table 5. Comparison of multinary composite with previous literature.