
Figures & data
Figure 1. Raw species occurrence records for Lacerta viridis in Northern Türkiye.
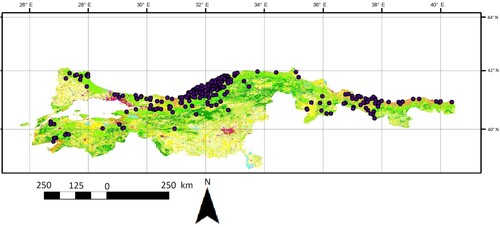
Figure 2. Habitat suitability predictions of Lacerta viridis (warmer colours refer to the high suitability level).
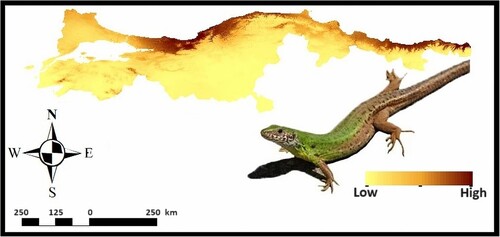
Table 1. Contribution of low correlated environmental variables in ENM of Lacerta viridis.
Table 2. Summary statistics for the best models selected for species distribution map of Lacerta viridis via kuenm package.
Table 3. Validation metrics used for comparison purposes in ENM of Lacerta viridis.
Figure 3. CORINE land cover types of Lacerta viridis in Northern Türkiye.
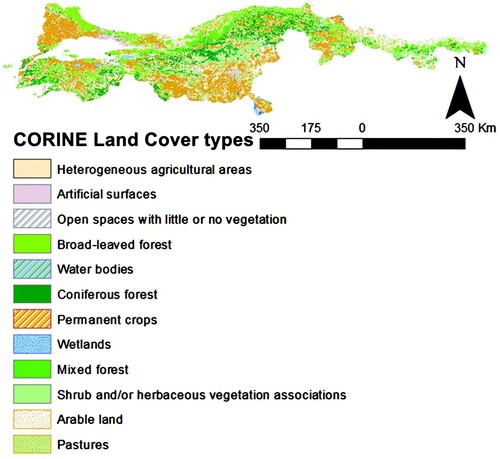
Table 4. GLM of environmental factors on the habitat use of Lacerta viridis.
Table 5. GLM of environmental factors on the habitat use of Lacerta viridis (focused on monthly precipitation in the active season).