Figures & data
Table 1. Annual mean, boreal summer and boreal winter changes of global mean net radiative flux at the top of the atmosphere (Net), SAT, SST, OHC in the upper 700 m of the ocean and OHC in the whole ocean in the MH, 20CW, and MWP.
Figure 1. Annual mean changes of SAT (contour lines; units: °C) and wind stress (arrows; units: N m−2) in the (a) MH, (b) 20CW, and (c) MWP. Color shading indicates statistically significant SAT changes at the 95% confidence level using the t-test.
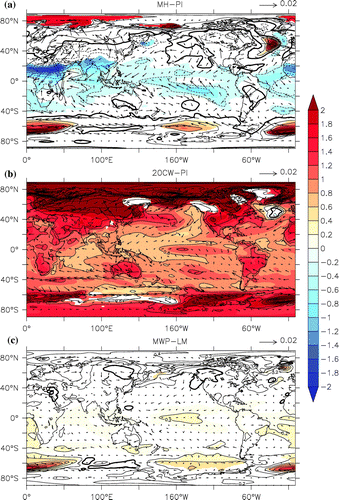
Figure 2. Changes in regional and annual mean (a, c, e) TOA radiative flux, including net heat flux (Net) and SR, and (b, d, f) surface heat flux, including net heat flux (Net), SR, DLR, LHF, and SHF, in the (a, b) MH, (c, d) 20CW, and (e, f) MWP. Downward is positive; units: W m−2.
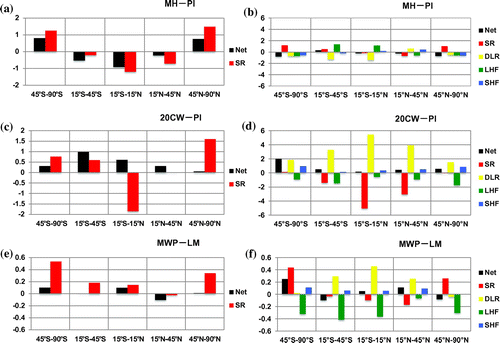
Figure 3. Changes in regional and annual mean LHF, the oceanic response of LHF (LHF_OcF), and the atmospheric forcing of LHF (LHF_AtF), in the (a) MH, (b) 20CW, and (c) MWP. Downward is positive; units: W m−2.
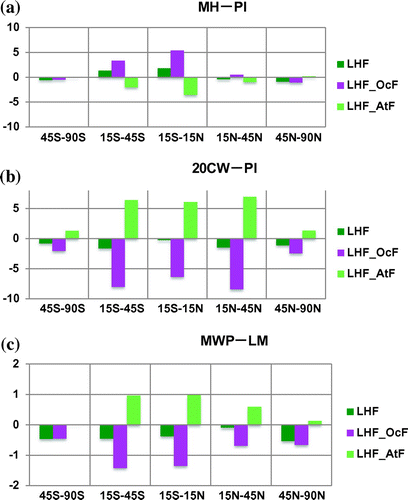
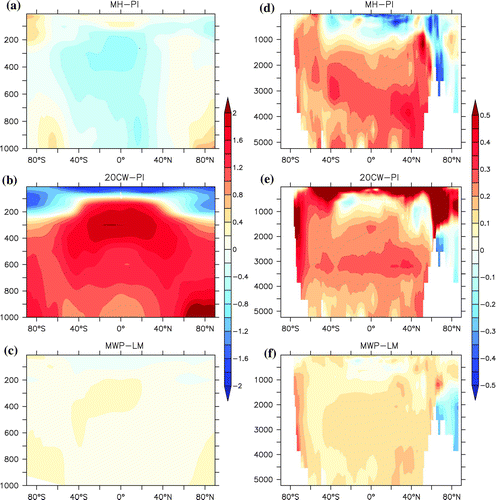
Figure 4. Annual mean changes in the vertical profile of (a–c) air temperature and (d–f) ocean temperature in the (a, d) MH, (b, e) 20CW, and (c, f) MWP. Units: °C.