Figures & data
Figure 1. (a) First EOF mode of winter NEC snowfall intensity. (b) Correlation map between autumn NPSSTI and winter snowfall intensity during 1960–2012 (dots with a cross mark mean correlations significant at the 90% confidence level). (c) Normalized time series of the first principal component (PC1; blue line) and winter NEC regional mean snowfall intensity (red line) during 1960–2012. (d) Time series of the autumn NPSSTI anomaly during 1960–2012 (units: °C).
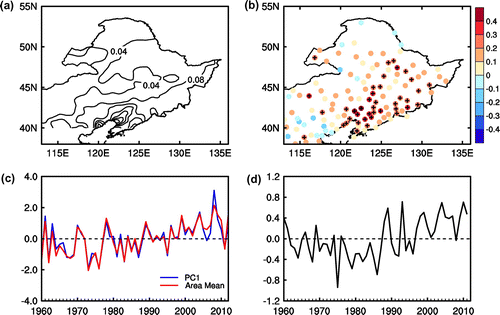
Figure 2. Correlation between (a) autumn and (b) winter North Pacific SST anomalies and winter NEC regional mean snowfall intensity. (c) Correlation of SST anomalies between autumn and winter during 1960–2012.
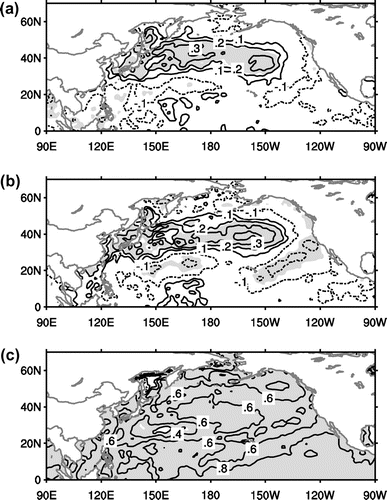
Figure 3. Linear regression of (a) winter SLP (units: hPa), (b) 500 hPa geopotential height (units: m) and (c) 850 hPa wind (units: m s−1) on the detrended autumn NPSSI anomaly. Panels (d–f) are the same as (a–c) but for liner regression on detrended winter NEC regional mean snowfall intensity.
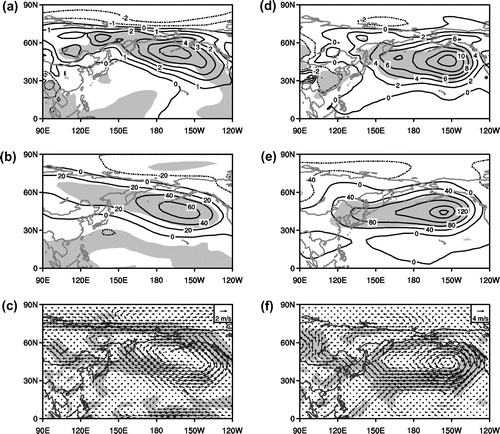
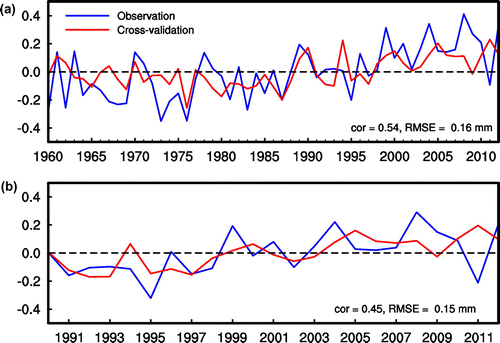
Figure 4. (a) The observed (blue line) and predicted (red line) winter NEC regional mean snowfall intensity anomaly (mm), based on leave-one-out cross-validation, for the period 1960–2012. (b) As in (a) but for the result of an independent sample test for the period 1990–2012.