Figures & data
Figure 1. Differences in (a) temperature and (b) salinity between the isopycnally averaged and isobarically averaged WAGHC climatology in the Kuroshio region at the 150 m level in January. (c, d) As in (a, b) but for the isopycnally averaged WAGHC minus WOA13 differences.
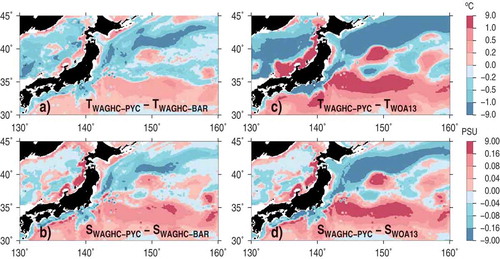
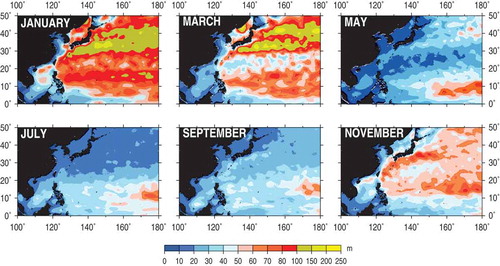
Figure 2. Upper mixed layer depth in the western Pacific Ocean for six selected calendar months.