Figures & data
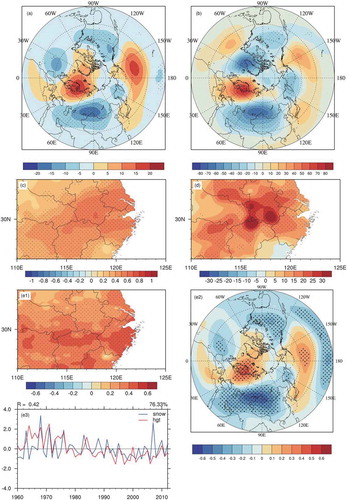
Figure 1. (a) Spatial distribution of the mean square deviation of winter snowfall (units: mm). (b) Spatial distribution and (c) time series of the first EOF leading mode of wintertime snowfall in the YHRB (lines) and the normalized regional average snowfall and winter snowfall (bars). (d) Correlation coefficient between the normalized regional average snowfall and winter snowfall (dotted areas indicate statistically significance at the 0.05 level).
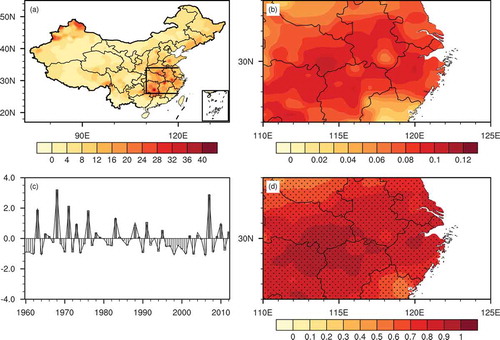
Figure 2. (a) Regression of winter 500 hPa geopotential height anomalies onto the time series of the normalized regional average winter snowfall in in the YHRB. (b) Difference in winter 500 hPa geopotential height anomalies (units: gpm) between high and low winter snowfall years. (c) Geographic distribution of the correlation coefficients between wintertime snowfall and SCANDI. (d) Difference in winter snowfall (units: mm) between positive and negative SCANDI years. (e) First coupled mode from SVD analysis of winter snowfall and 500 hPa geopotential height (the ratio of covariance to total covariance is 76.33%): (e1) heterogeneous correlation for winter snowfall; (e2) heterogeneous correlation for 500 hPa geopotential height; and (e3) time series (blue line for snowfall and red line for geopotential height; the correlation coefficient between them is 0.42; dotted areas are statistically significant at the 0.1 level).
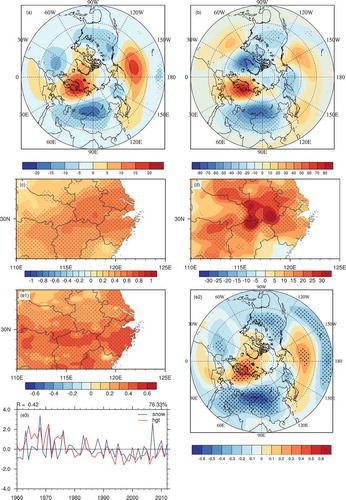
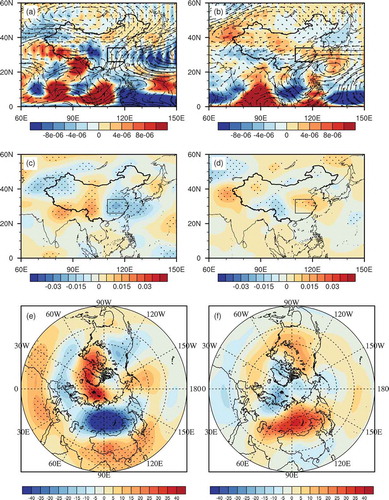
Figure 3. (a, b) 1000–700 hPa water vapor transport flux anomalies (vectors; units: kg m−1 s−1) and water vapor flux divergence anomalies (shaded; kg m−2 s−1) for (a) positive and (b) negative SCANDI years. (c, d) 500 hPa vertical velocity anomaly (Pa s−1) for (c) positive and (c) negative SCANDI years. (e, f) 1000–500 hPa thickness (units: gpm) for (e) positive and (f) negative SCANDI years (dotted areas are statistically significant at the 0.1 level).