Figures & data
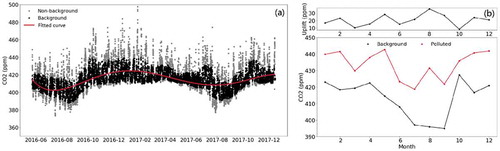
Figure 1. Time series of regional background (black) and non-background (gray) CO2 concentrations in Xinglong.
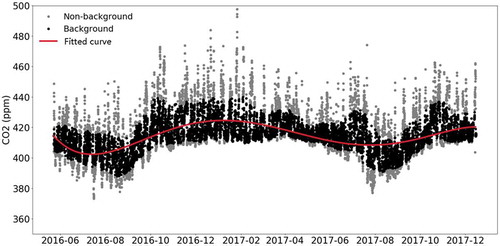
Figure 2. Monthly cycles of local sources and regional background CO2 concentrations over a 12-month period. The upper panel shows the differences between the local sources and regional background CO2 concentrations over a 12-month period. The lower panel shows the monthly cycles of local sources and regional background CO2 concentrations over a 12-month period.
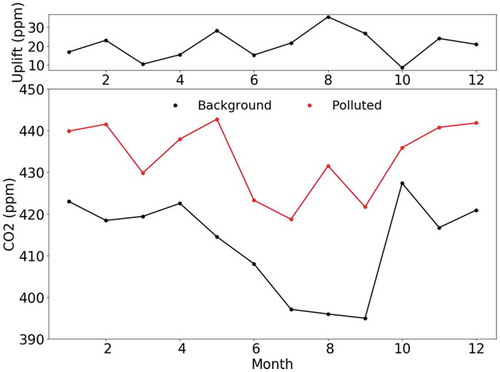
Figure 3. Diurnal cycles of regional background concentrations of CO2 by season.
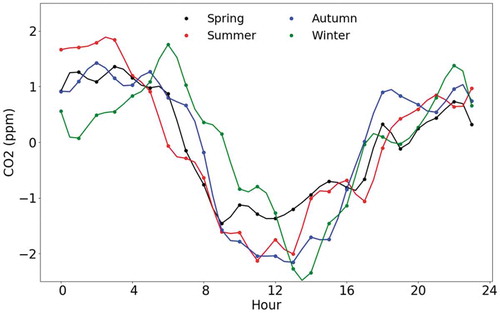
Table 1. Statistical analysis of cluster trajectories, including trajectory numbers, ratios, average CO2 concentrations in each cluster, and the regions each cluster runs through.
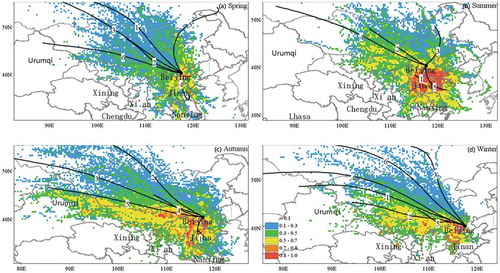
Figure 4. Cluster analysis of 72-h backward trajectory and PSCF analysis of CO2 in Xinglong from May 2016 to December 2017. The numbers indicate the trajectory clustering type and the color depth represents the probability distribution of the emission sources: the deeper the color, the greater the contribution.