Figures & data
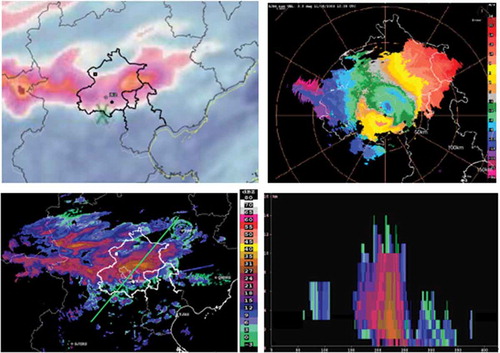
Figure 1. (a) 850-hPa streamlines and specific humidity (dashed) at 2000LST8 November 2009, where A is Beibu Gulf, B is Beijing, and the frame is the area used for (c). (b) Sea level pressure and 500-hPa height (dashed) at 2000LST9 November 2009. (c) RUC product of 0°C height at 0000 LST 10 November 2009, where the star is the profile location for (d). (d) Sounding of GXT at 2000LST 9 November.
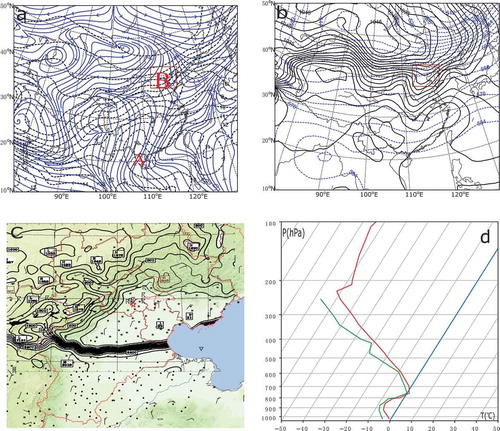
Figure 2. Microwave radiometer observation from 0800 LST 9 November to 0300 LST 10 November 2009 at GXT station. From top to bottom: temperature, relative humidity, and liquid water.
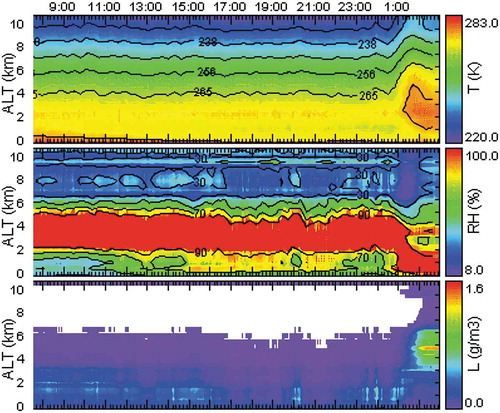
Figure 3. Wind profiler observation at Haidian station, from 0800 LST 9 November to 0200 LST 10 November.
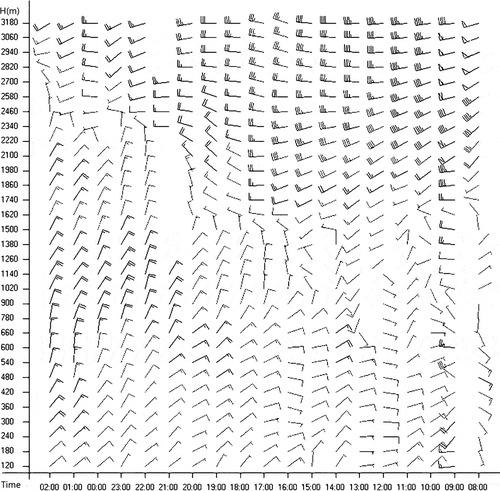
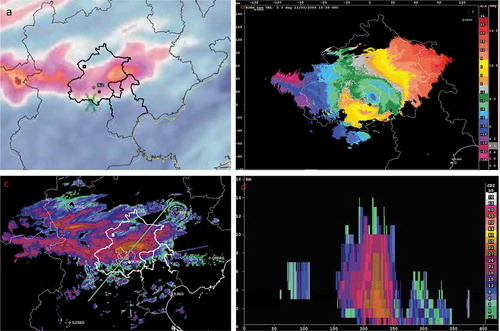
Figure 4. (a) FY Chinese weather satellite infrared images at 0000 LST 10 November 2009, in which the solid point is the radiometer and the circle is the wind profiler at Haidian. (b) Velocity image of Beijing SA radar at 3.3° elevation at the same time as (a). (c) Radar reflectivity mosaic of 3.5 km at the same time as (a), where the green line is the position for cross section. (d) Reflectivity cross section at the same time as (a).