Figures & data

Table 1. Basic information of the CMIP5 and CMIP6 models used in this study
Figure 1. The summer mean U200 in NCEP reanalysis, the CMIP6 MME, and the individual models averaged over 1986–2005. Shading depicts region with U200 exceeding 25 m s–1. Units: m s–1
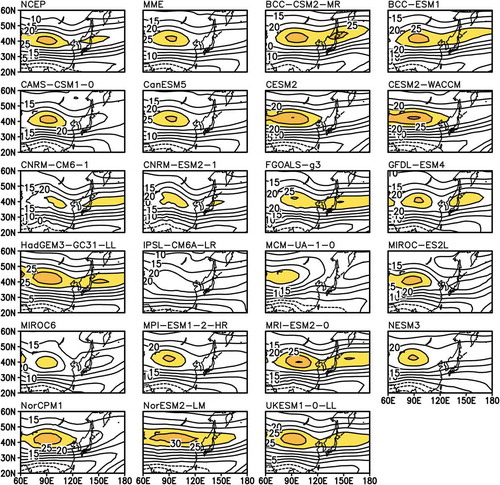
Figure 2. (a) Taylor diagram of U200 over (20°–60°N, 60°–180°E) between the NCEP Reanalysis data and CMIP5 (blue) and CMIP6 (red) model outputs during the period of 1986–2005. The solid line indicates the root-mean-square error; the dashed line indicates the normalized standard deviation; the dot line indicates the correlation coefficient of 0.6 and 0.9. (b) The CMIP5 MME summer U200 bias (shading) and the inter-model standard deviation of biases (contour lines). Units: m s–1. (c) As in (b), but for the CMIP6 MME
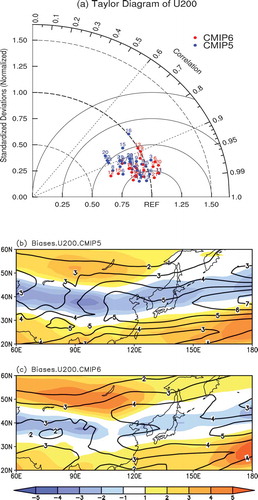
Figure 3. (a) Climatological locations of the summer EAJ’s core in 29 CMIP5 models (red triangles), the MME (blue multiplication sign), and the observation (blue cross), where U200 is maximum over the domain (20°–60°N, 60°–180°E). Sizes of triangles depict numbers of models. (b) As in (a), but for the CMIP6 models. (c) Boxplot of EAJ-intensity indices. Black line in box indicates the median, the black multiplication sign indicates the MME, and black dots indicate the individual models. The observed value in the NCEP reanalysis is given in top-right corner. Units: m s–1
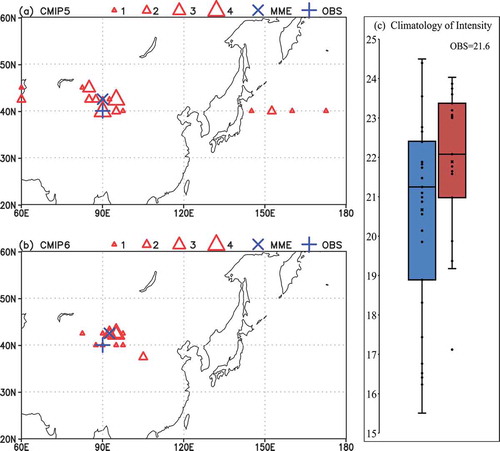
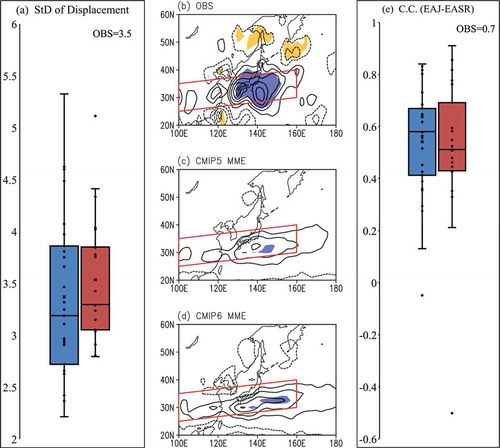
Figure 4. (a) Boxplot of the interannual variability in EAJ’s meridional displacement, which is depicted by standard deviation, in the CMIP5 and CMIP6 models, respectively (Units: m s–1). Black line in box indicates the median, the black multiplication sign indicates the MME, and black dots indicate the individual models. The observed value is given in top-right corner. (b) The summer precipitation regressed onto the standardized EAJ meridional displacement index in the observation (Units: mm d–1). The contour lines indicate the regression coefficient, with the interval being 0.2, and the values significant at the 0.05 level are shaded (yellow, negative; blue, positive). The parallelogram indicates the region used to define the EASRI. (c) As in (b), but for the CMIP5 MME. (d) As in (b), but for the CMIP6 MME. (e) As in (a), but for the correlation coefficients between the EAJ meridional displacement index and the EASRI