Figures & data

Figure 1. 20–100-day band-pass-filtered U850 variance (contours; units: m2 s−2) and its percentage contribution (shaded) to the total variance in (a) NCEP–NCAR reanalysis and (c) GAMIL3. (b, d) As in (a, c) but for OLR (units: W2 m−4) from NOAA AVHRR and GAMIL3, respectively
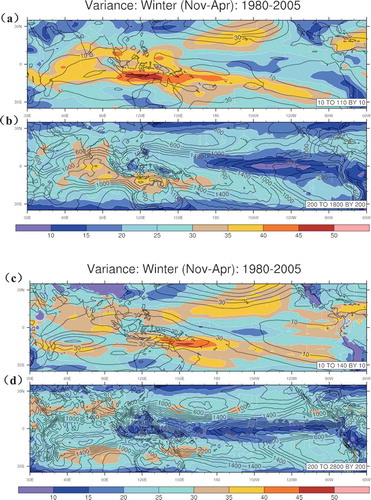
Table 1. Eastward/westward (E/W) and eastward/observation (E/O) ratios within the MJO frequency–wavenumber ranges (30–80-day period, wavenumbers 1–3) for the single equatorial fields of OLR and U850
Figure 2. November–April (1980–2005) wavenumber–frequency spectra of 10°N–10°S-averaged daily U850 from (a) NCEP and (b) GAMIL3; and daily OLR fields from (c) NOAA satellite OLR and (d) GAMIL3. The dashed lines indicate the MJO band (30 d to 80 d)
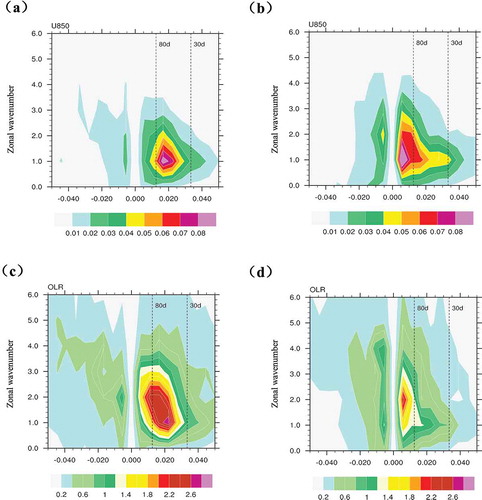
Figure 3. Coherence-squared (colors) and phase relationships (vectors) between U850 and OLR for (a) NCEP winds and satellite OLR, and (b) GAMIL3 winds and OLR simulation. Colors represent coherence-squared between OLR and U850, and vectors represent the phase by which wind anomalies lag OLR anomalies, increasing in the clockwise direction
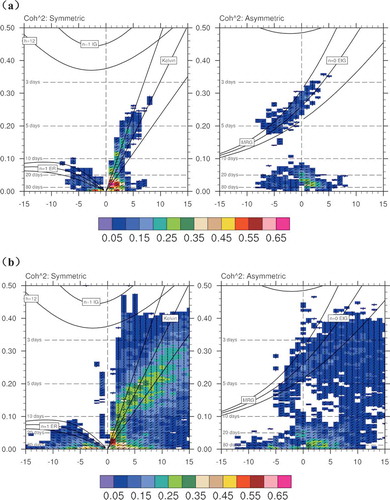
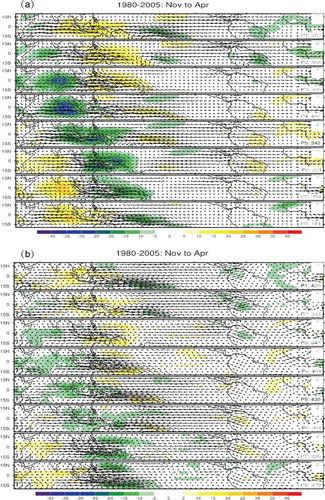
Figure 4. Composite MJO OLR (shaded; units W m−2) and 850-hPa wind anomalies (vectors; units: m s−1) in eight phases from November to April from (a) observations and (b) GAMIL3. The reference vector in units of m s−1 is in the upper right, and the phase and number of days used are in the lower right, of each panel