Figures & data

Figure 1. In-phase covariability of the IIV and MEBR for the ISM. (a) Time series of JJA ISM index on the interannual time scale during 1958–2018. (b) The 21-yr sliding IIV of the ISM based on the 21-yr running standard deviation. (c) Scatterplot between the 21-yr sliding IIV of the ISM and 21-yr sliding MEBRI for the ISM. 21-yr sliding correlation coefficients between (d) the JJA monsoon index and preceding DJF Niño3.4 index (i.e., Cor1 in EquationEquation (1)(1)
(1) ), (e) the JJA monsoon index and subsequent DJF Niño3.4 index (i.e., Cor2 in EquationEquation (1)
(1)
(1) ). (f) The 21-yr sliding MEBRI for the ISM based on EquationEquation (1)
(1)
(1) . The dashed lines in (b) and (f) represent the long-term mean values during the analysis period. The red dots in (d) and (e) denote the correlation is significant at the 0.05 level. The asterisk next to the correlation coefficient in the upper-right corner of (c) indicates that the correlation is significant at the 0.05 level.
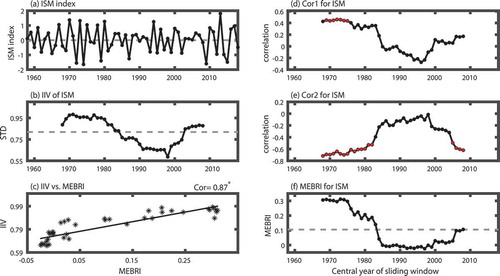
Figure 2. In-phase covariability of the IIV and MEBR for the WNPSM. (a) Time series of JJA WNPSM index on the interannual time scale during 1958–2018. (b) The 21-yr sliding IIV of the WNPSM based on the 21-yr running standard deviation. (c) Scatterplot between the 21-yr sliding IIV of the WNPSM and 21-yr sliding MEBRI for the WNPSM. 21-yr sliding correlation coefficients between (d) the JJA WNPSM index and preceding DJF Niño3.4 index (i.e., Cor1 in EquationEquation (1)(1)
(1) ), (e) the JJA WNPSM index and subsequent DJF Niño3.4 index (i.e., Cor2 in EquationEquation (1)
(1)
(1) ). (f) The 21-yr sliding MEBRI for the WNPSM based on EquationEquation (1)
(1)
(1) . The dashed lines in (b) and (f) represent the long-term mean values during the analysis period. The red dots in (d) and (e) denote the correlation is significant at the 0.05 level. The asterisk next to the correlation coefficient in the upper-right corner of (c) indicates that the correlation is significant at the 0.05 level.
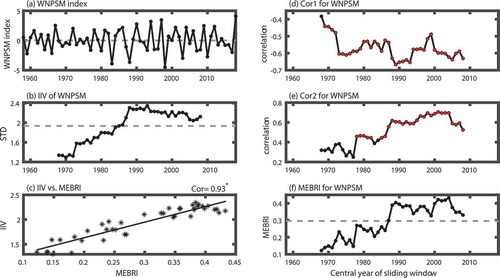
Figure 3. Out-of-phase covariability between the ISM and the WNPSM in terms of their IIV and MEBR variability. (a) Scatterplot between the 21-yr sliding IIV of the ISM and that of the WNPSM, (b) Scatterplot between the 21-yr sliding MEBRI of the ISM and that of the WNPSM. The asterisk next to the correlation coefficient in the upper-right corner indicates that the correlation is significant at the 0.05 level.
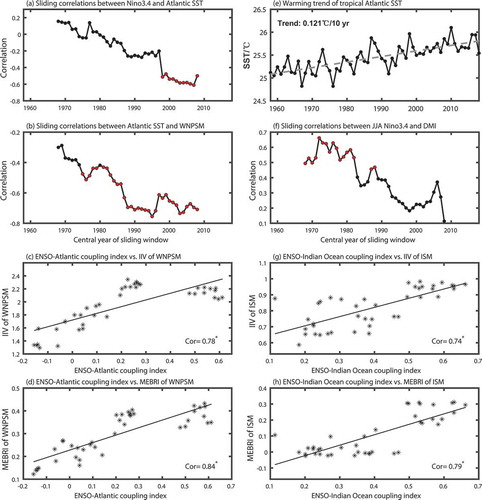
Figure 4. Increasing influences from the tropical Atlantic SST. 21-yr sliding correlation coefficients between (a) JJA Niño3.4 index and JJA tropical Atlantic SST index, (b) JJA tropical Atlantic SST index and JJA WNPSM index. Scatterplot between the 21-yr sliding ENSO–Atlantic coupling index and (c) 21-yr sliding IIV of the WNPSM, and (d) 21-yr sliding MEBRI of the WNPSM. (e) The warming trend of JJA tropical Atlantic SST during 1958–2018. (f) 21-yr sliding correlation coefficients between JJA Niño3.4 index and JJA DMI. Scatterplot between the 21-yr sliding ENSO–Indian Ocean coupling index and (g) 21-yr sliding IIV of the ISM, and (h) 21-yr sliding MEBRI of the ISM. The red dots in (a), (b), and (f) denote the correlation is significant at the 0.05 level. The asterisk next to the correlation coefficient in the upper-right corner indicates that the correlation is significant at the 0.05 level.