
Figures & data
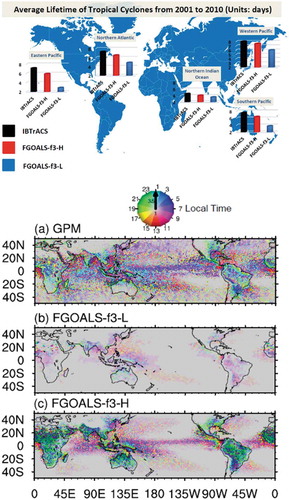
Table 1. Experimental design
Figure 1. The average lifetimes of TCs in the global regions of the western Pacific, southern Pacific, northern Indian Ocean, northern Atlantic, and eastern Pacific, from 2001 to 2010, in units of days. IBTrACS, version v03r09, is used as the observation (black bars). The average lifetimes of TCs in the 0.25° FGOALS-f3-H and 1° FGOALS-f3-L are shown as red and blue bars, respectively
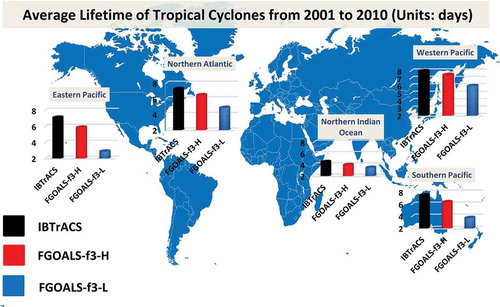
Figure 2. Annual mean timing phase (color) and amplitude (color density) of the total precipitation (units: mm h−1) in the tropics and midlatitudes from seven years of hourly averaged data for (a) GPM, (b) 1° FGOALS-f3-L highresSST-present r1i1p1f1, and (c) 0.25° FGOALS-f3-H highresSST-present r1i1p1f1. GPM, FGOALS-f3-L, and FGOALS-f3-H are from 2008–14. In this figure, GPM and FGOALS-f3-H are interpolated to 1°, the same as the resolution of FGOALS-f3-L. The domain is the tropical and midlatitude region (50°S–50°N)
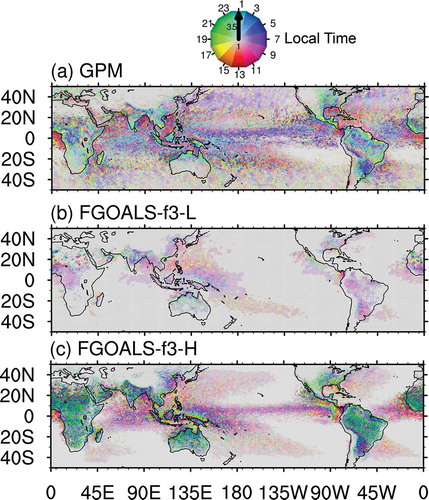
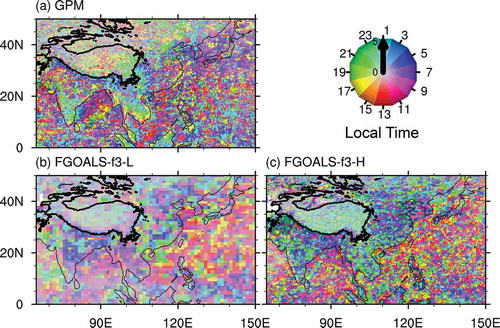
Figure 3. The boreal summer mean timing phase (color) and amplitude (color density) of the total precipitation (units: mm h−1) in the Asian regions from seven years of hourly averaged data for (a) GPM, (b) 1° FGOALS-f3-L highresSST-present r1i1p1f1, and (c) 0.25° FGOALS-f3-H highresSST-present r1i1p1f1. GPM, FGOALS-f3-L, and FGOALS-f3-H are from 2008–14. In this figure, GPM and FGOALS-f3-H are interpolated to 1°, the same as the resolution of FGOALS-f3-L. The thick black lines mask the elevation of 2000 m
Data availability statement
The data that support the findings of this study are available from the following sources: https://esgf-node.llnl.gov/projects/cmip6/.