Figures & data

Figure 1. Spatial distributions of precipitation (shading; units: mm d−1), the 5880 gpm isoline at 500 hPa (contour), and the low-level wind at 850 hPa (vectors; units: m s−1) averaged from June to August 2005 over the WNP derived from (a) observation, (b) WRF4_CTRL, and (c) WRF4_CPL. (d) Taylor diagram evaluating the WRF4_CTRL and WRF4_CPL simulations of precipitation (Pr), geopotential height at 500 hPa (H500), and horizontal (U850) and meridional (V850) winds at 850 hPa over the WNP. The angular coordinates are the correlation coefficients between the model results and the observations. The radial coordinate is the standard deviation of the model results divided by the standard deviation of the observations
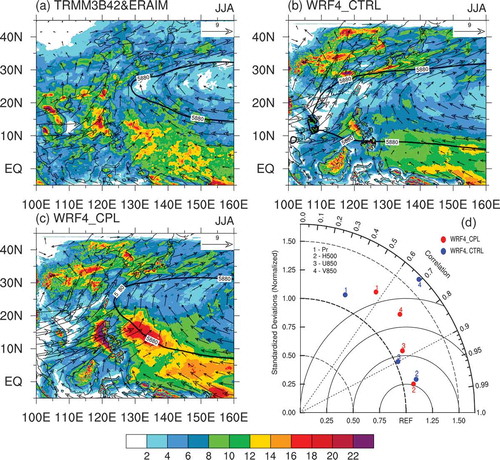
Figure 2. (a) Differences in rainfall (shading; units: mm d−1) and wind vector at 850 hPa (vectors; units: m s−1) averaged from June to August of 2005 between WRF4_CPL and WRF4_CTRL (WRF4_CPL minus WRF4_CTRL). (b) Moisture processes responsible for rainfall differences over the region (10°–20°N, 115°–140°E) averaged from June to August of 2005 between WRF4_CPL and WRF4_CTRL (WRF4_CPL minus WRF4_CTRL). (c) Budget analysis of the moist static energy equation for the region (10°–20°N, 115°–140°E). See text for details
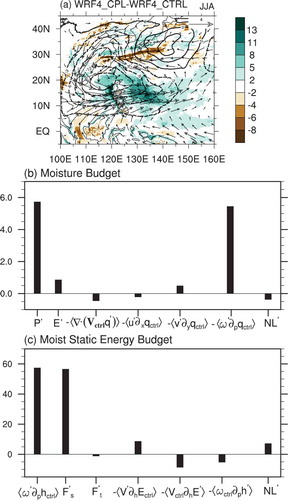
Table 1. Observed and simulated net solar radiation (SR), longwave radiation (LW), sensible heat (SH), and latent heat (LH) at the sea surface averaged from June to August 2005 for the region (10°–20°N, 115°–140°E). The observed radiation fluxes (turbulence fluxes) are from CERES (OAFlux) data. Downward is positive for SR, while upward is positive for the other heat fluxes. Units: W m−2.
Figure 3. Spatial distributions of net sea surface heat fluxes (downward is positive; units: W m−2) averaged from June to August of 2005 derived from (a) observation, (b) WRF4_CTRL, and (c) WRF_CPL. (d) Spatial distributions of the simulated SST biases from WRF4_CPL
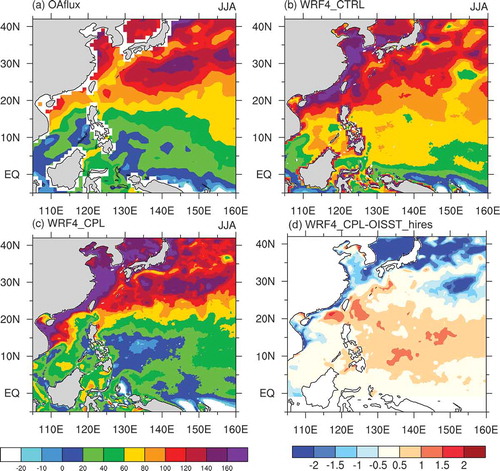
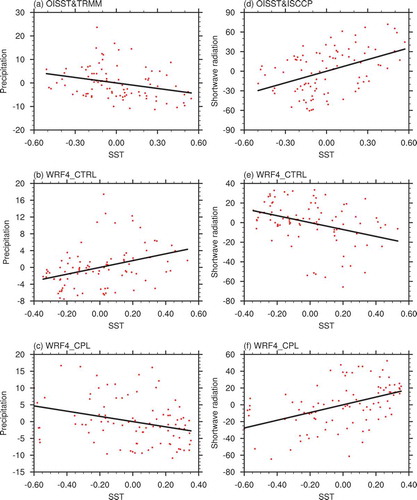
Figure 4. (a–c) Scatterplots of the regional-averaged daily SST (units: °C) and precipitation (units: mm d−1) anomalies over the region (10°–20°N, 115°–140°E) from 1 June to 31 August 2005 from (a) observation, (b) WRF4_CTRL, and (c) WRF4_CPL. (d–f) Scatterplots of the regional-averaged SST (units: °C) and sea surface net shortwave radiation (units: W m−2) from (d) observation, (e) WRF4_CTRL, and (f) WRF4_CPL. The monthly means of rainfall, SST, and sea surface net shortwave radiation have been removed from the original data