Figures & data

Figure 1. Distribution of (a) cumulative NMR, (b) cumulative DR (dots; units: mm), and (c) the terrain height over South China (units: km)
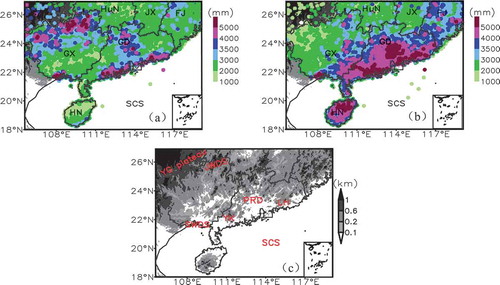
Figure 2. Distribution of the average occurrence time of (a) NMR and (b) NMTR (>20 mm·h−1)
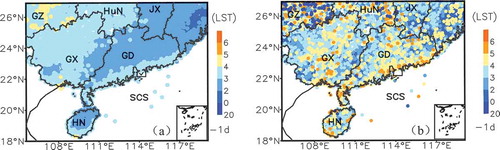
Figure 3. Distribution of the frequency of NMR from 2000 LST to 0800 LST at 2-h intervals. The rectangle in (e), (f), and (g) denotes the NMTR areas over the mountainous regions in the north of GX
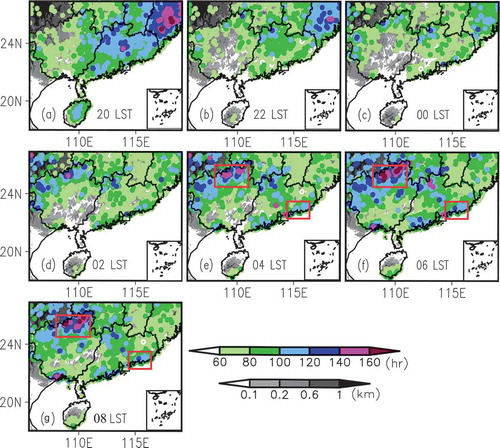
Figure 4. Distribution of average surface winds at −3 h (3 h before the occurrence time of heavy rainfall, where the red vectors denote southerly-wind differences and the blue vectors denote northerly-wind differences) and the average surface temperature at −3 h (dots; units: °C) over the (a) north of GX and (b) southeast coast of GD. The red rectangle denotes the key NMTR region over the north of GX and southeast coast of GD
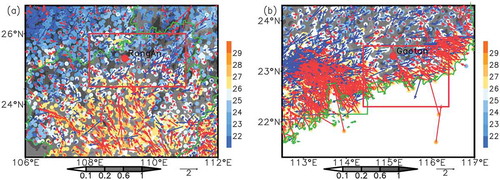
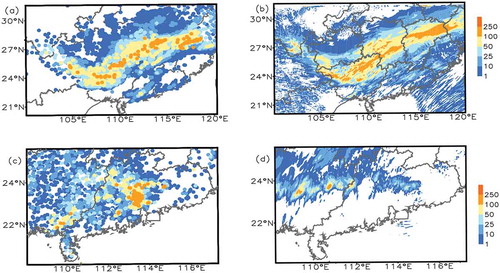
Figure 5. Comparisons of NMR between (a, c) observation and (b, d) simulation by 12-h cumulative precipitation beginning from (a, b) 2000 LST 8 July 2019 and (c, d) 2000 LST 6 May 2017