Figures & data
Figure 1. Spatial distribution of the linear trend of annual mean PET during 1979–2017 (units: mm d−1/50 yr). The pattern correlation (r) is the linear trend of (a) the CRU observational data with (b) the ERA5 dataset, (c) the CMIP5 simulation, and (d) the CMIP6 simulation. The shading indicates that the area passed the 0.05 significance test
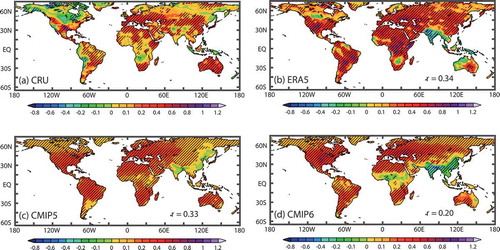
Figure 2. Leading empirical orthogonal function (EOF) of the monthly global terrestrial PET anomalies during 1979–2017. The EPV is the explained percentage of the total variance in (a-d), and the value of EOF multiplied by 100. The pattern correlation (R) is the leading EOF of (a) the CRU observational data with (b) the ERA5 dataset, (c) the CMIP5 simulation, and (d) the CMIP6 simulation. (e) Nine-point moving average principal component (PC) and correlation coefficient (R1–R3) between the CRU observational dataset and other datasets
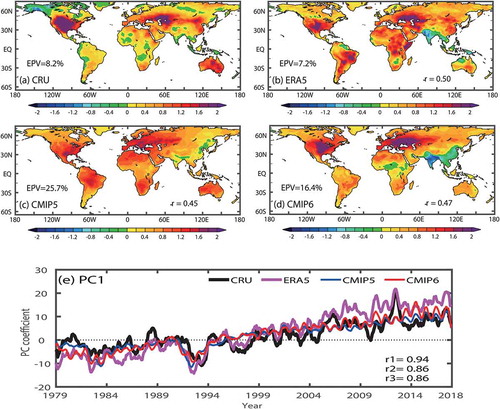
Figure 3. Time series of the interannual global terrestrial PET anomalies for the CRU observational dataset (black) from 1979 to 2017, the ERA5 reanalysis dataset (green) from 1979 to 2017, and the CMIP5 (blue) and CMIP6 (red) ensemble means from 1979 to 2099 (units: mm d−1) under (a, c, e) low-to-moderate emission scenarios and (b, d, f) high emission scenarios, for (a, b) global land (60°S–75°N), (c, d) Northern Hemisphere land (0°–75°N), and (e, f) Southern Hemisphere land (60°S–0°). The shaded areas indicate the ranges of the changes in the results of different models of CMIP5 and CMIP6
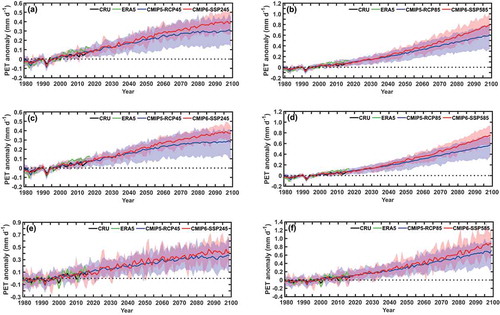
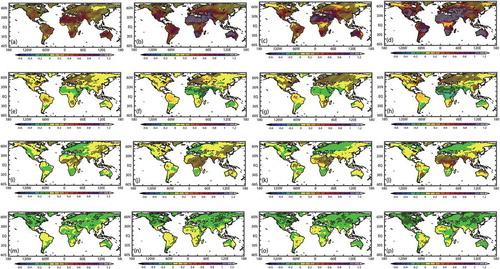
Figure 4. Spatial distribution of the annual change in PET caused by the (a–d) VPD, (e–h) Rns, (i–l) Rnl, and (m–p) sfcWind, over land areas from 1979–99 to 2079–99 (units: mm d−1) in the CMIP5 models under the RCP4.5 scenario (left-hand column) and the RCP8.5 scenario (left-middle column), the CMIP6 models under the SSP2.45 scenario (right-middle column), and the SSP5.85 scenario (right-hand column). Shading indicates that at least 80% of the models agree on the sign of the change