
Figures & data
Figure 1. PRISMA flowchart – Study methodology of excluded and included documents. Source: adapted from [Citation13].
![Figure 1. PRISMA flowchart – Study methodology of excluded and included documents. Source: adapted from [Citation13].](/cms/asset/39ba994c-ccda-44f3-9c54-fdcc1ba8166a/thbr_a_2241964_f0001_oc.jpg)
Figure 2. Number of documents using each coastal vulnerability assessment method.
Source: Authors
Table 1. Spatial scales found in reviewed documents.
Figure 3. Relationship between assessment studies’ locations and spatial scale.Source: Authors.
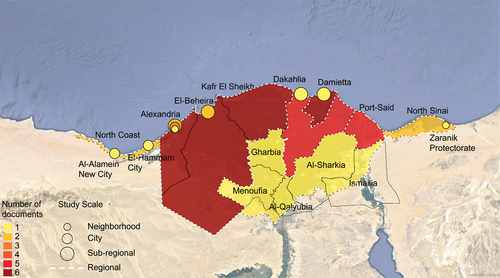
Figure 4. Number of documents using each variable across different scales.Source: Authors.
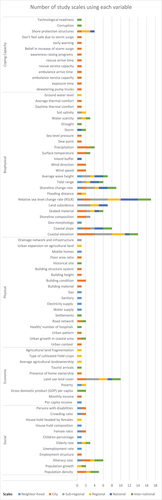
Figure 5. Collective chart between the used methods, spatial scale, and variables..
Source: Authors
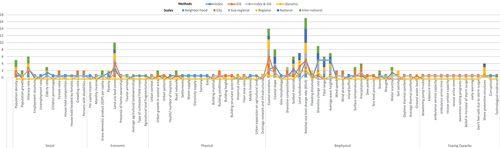
Table 2. Future research vulnerability assessment approaches.