Figures & data
Figure 1. Gebel Libni and Wadi Mashashe region of North-central Sinai, Egypt shown on a geological map [Citation18].
![Figure 1. Gebel Libni and Wadi Mashashe region of North-central Sinai, Egypt shown on a geological map [Citation18].](/cms/asset/00b4e2b9-6988-4656-bfe4-7b9bb23ce810/thbr_a_2243176_f0001_oc.jpg)
Table 1. Compositions and proportions of the studied mixes (wt. %), NaOH solution molarities and liquid/solid ratios.
Table 2. Compositions of the utilized materials’ oxides and the amount of loss on ignition.
Figure 2. TGA and DTA graphs of MC sample applied.
Figure 3. Used raw clay (MC) and overburden (OD) samples’ XRD patterns.
Figure 4. XRD patterns of the used industrial wastes of CKD, WCS and calcined clay (MCC) sample.
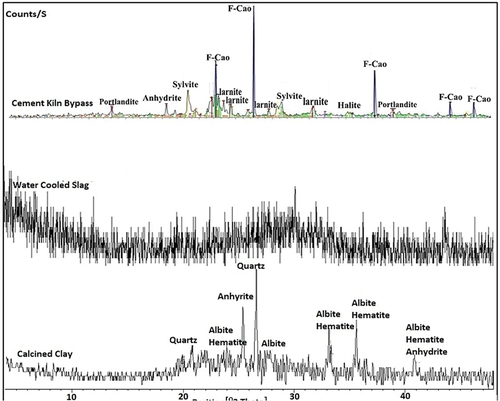
Figure 5. FTIR comparison spectra of Mashashe clay (MC) and Mashashe calcined clay (MCC). [1: O-H bond elongation vibration 2: vibration bending for Al-OH, 4: H-O-H elongation vibration, 5:elongation of Si-O-Si, 6: Al-OH elongation vibration, 7: O-H deformation of Fe+3 8: Si-O-Si stretching vibration, 9: Si-O-Si elongation vibration, 10: elongation vibration of Al-O-Si bond, 11,12: Si-O-Si elongation vibration bond, 13: Si-O-Fe elongation mode].
![Figure 5. FTIR comparison spectra of Mashashe clay (MC) and Mashashe calcined clay (MCC). [1: O-H bond elongation vibration 2: vibration bending for Al-OH, 4: H-O-H elongation vibration, 5:elongation of Si-O-Si, 6: Al-OH elongation vibration, 7: O-H deformation of Fe+3 8: Si-O-Si stretching vibration, 9: Si-O-Si elongation vibration, 10: elongation vibration of Al-O-Si bond, 11,12: Si-O-Si elongation vibration bond, 13: Si-O-Fe elongation mode].](/cms/asset/3e70bafc-8749-4b12-a174-c985922dc472/thbr_a_2243176_f0005_oc.jpg)
Figure 6. SEM images of different magnifications for MC sample (a, b) and its EDX spectrum of elemental composition (c).
Figure 7. SEM images of different magnifications for WCS sample (a, b) and it’s EDX spectrum of elemental composition (c).
Figure 8. XRD patterns of hardened alkali-activated mixes (M-1 to M-3) (Q: Quartz, A: Albite, H: Halite, G: Gypsum and C: Calcite,).
Figure 9. XRD patterns of hardened alkali-activated mixes (M-4 to M-6) (G: Gypsum; Q: Quartz; C: Calcite).
Figure 10. Effect of mixtures on the characteristics of specimens with alkali activation after 28 days of curing.
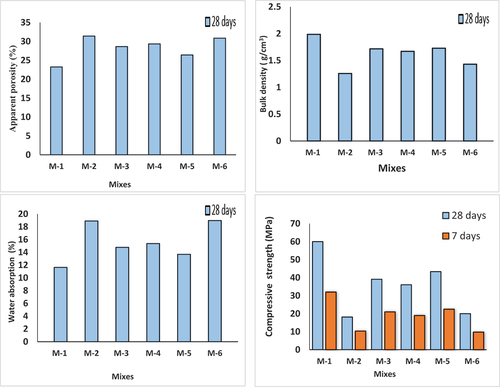
Figure 11. Influence of fire on the compressive strength of the 28-days cured, alkaliactivated binder of mix M-1.
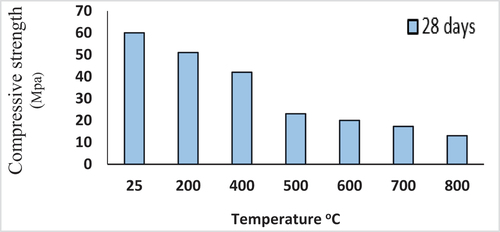
Figure 12. FTIR comparison spectra of different mixtures (M-1 to M-6) of alkali activated binders represented variation in bands. [1: vibration bending for O-H bond, 2-3 bonds for organic matter, 4: extending for H-O-H vibration, 5–6: CO2’s elongation vibration, 7: The (T-OSi) location of an asymmetric elongation vibration. 8–9: Si-O bending bands.10: Si-O-Si & AlO-Si asymmetric vibrations of elongation. 11: Si-O and O-Si-O vibrational cause bends in.
Figure 13. SEM images of the morphology of the formed alkali activated binder show a dense texture (a), unreacted particles accompanied with little open pores and agglomerated wavy – glassy matrix (b).
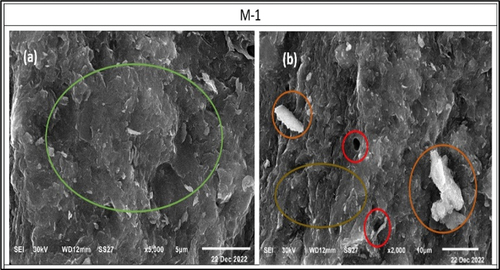
Figure 14. SEM images of specimens of mixture M-2, mixture M-3 and mixture M-6 show types of deformed structures (M 2, a-b), unreacted particles (M-3, a-b), micro-cracks and open pores (M-6, a-b).
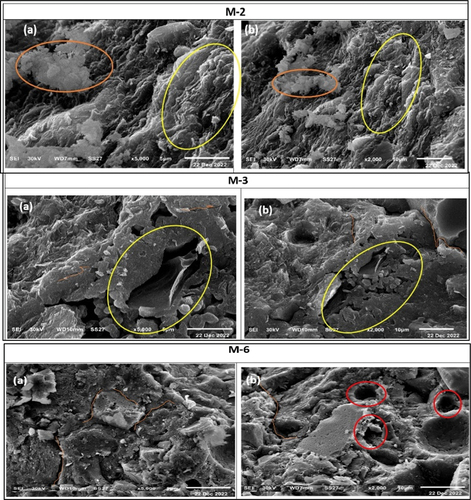
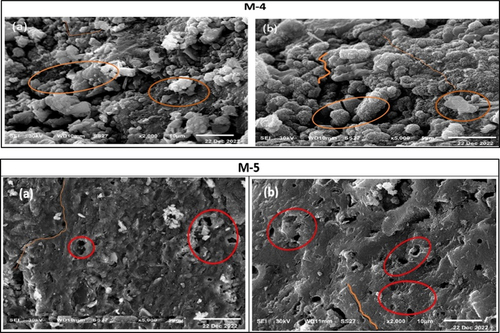
Figure 15. SEM images of specimens of mixes M-4 and M-5 clarify a heterogeneous loose structure (M-4, a-b), many open pores, micro cracks, and little unreacted particles (M-5, a-b).