Figures & data
Table 1. Chemical oxide composition for SSA and GGBS.
Table 2. The studied mixes composition containing GGBS and SSA materials.
Figure 1. The X-ray diffraction patterns of slag and SSA materials and geopolymer specimens. (Q: Quartz, C–S–H: CaH2O4Si, N: Anhydrite, AK: Akermanite, A: Albite, H: Hematite and Z: Zeolite)
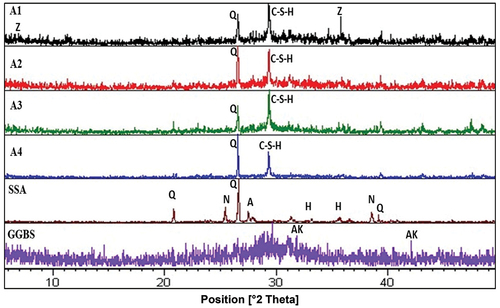
Figure 2. FTIR spectra of GGBS and SSA raw materials and geopolymer specimens (cured at 90 days) with different percentages of alkaline activator [1: Stretching vibration of O–H bond, 2: Bending vibration of H–O–H, 3: Stretching vibration of CO2, 4: Asymmetric stretching vibration of (T–O–Si), 5: Symmetric stretching vibration of (Si–O–Si), 6: Stretching vibration of Carbonate 7: stretching vibration of (Si–O), 8: stretching vibration of (Fe–O), 9: stretching vibration of [(N, C)–A–S–H], 10: stretching vibration of (C–S–H) and 11: Zeolite formation].
![Figure 2. FTIR spectra of GGBS and SSA raw materials and geopolymer specimens (cured at 90 days) with different percentages of alkaline activator [1: Stretching vibration of O–H bond, 2: Bending vibration of H–O–H, 3: Stretching vibration of CO2, 4: Asymmetric stretching vibration of (T–O–Si), 5: Symmetric stretching vibration of (Si–O–Si), 6: Stretching vibration of Carbonate 7: stretching vibration of (Si–O), 8: stretching vibration of (Fe–O), 9: stretching vibration of [(N, C)–A–S–H], 10: stretching vibration of (C–S–H) and 11: Zeolite formation].](/cms/asset/97add3eb-e4c3-4c76-a384-95793889c51b/thbr_a_2252231_f0002_b.gif)
Figure 3. SEM micrographs of A1, A2, A3 and A4 geopolymer pastes at 90 days.
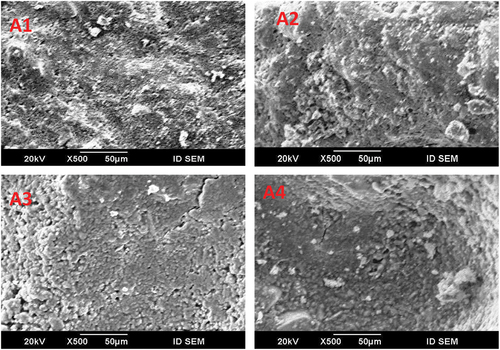
Figure 4. Compressive strength for hardened geopolymer specimens.