Figures & data
Table 1. Cooperative housing alliance targets according to SDGs.
Table 2. Cooperative housing alliance indicators.
Figure 1. Dwellings in newly constructed multi-family buildings by type of ownership (1971–2010).
Source: Swedish official statistics, Yearbook of Housing and Building Statistics, 2012
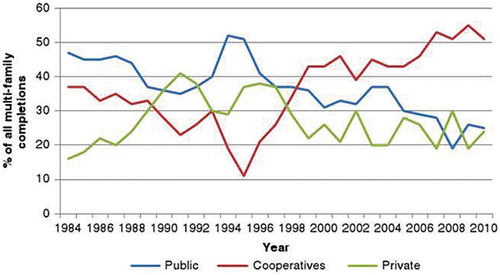
Figure 2. The top 10 city prosperity index containing Stockholm, Sweden.
Source: City Prosperity Index (CPI 2015)
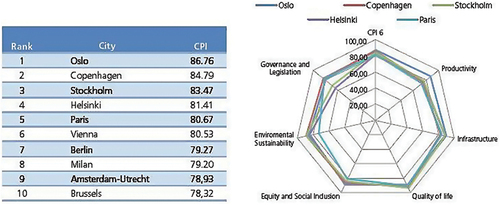
Figure 3. Cairo CPI dimensions.
Source: UN Habitat, State of the World’s Cities Report 2012/2013: Prosperity of Cities, World Urban Forum Edition
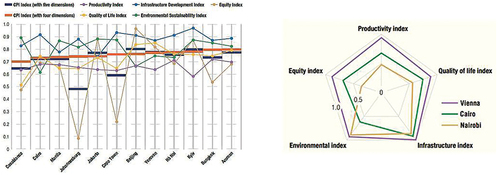
Table 3. Proposed checklist from GRI guidelines to compare between housing cooperative models.
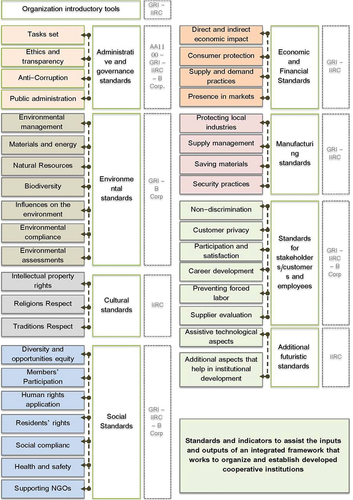
Figure 4. Integrated cooperative housing framework guidelines.
Source: Researchers
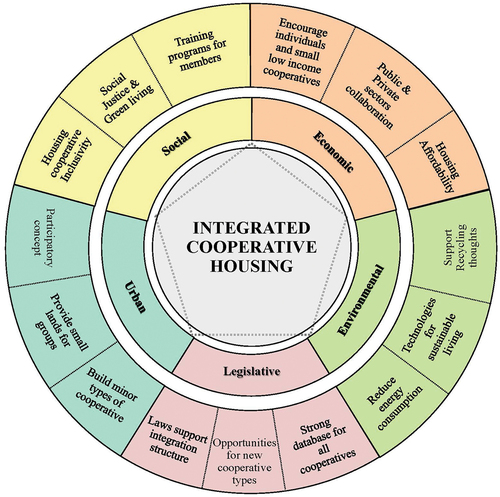
Figure 5. Set of standards for an initial framework for an integrated housing cooperative.
Source: Researchers