Figures & data
Figure 1. The development of Oman National Transport Company Services [Citation12].
![Figure 1. The development of Oman National Transport Company Services [Citation12].](/cms/asset/577e96f3-ab28-4585-89cf-a3723cd8d72b/thbr_a_2305068_f0001_oc.jpg)
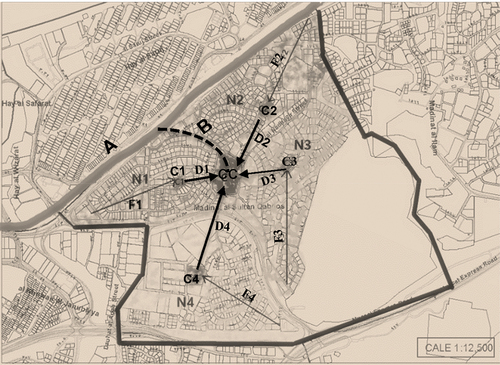
Figure 2. The Current Distribution of Transit Stops in Muscat Is Convenient to Limited Population Close to the Bus City Routs Based On 1 Km Euclidean Distance (The map source is the annual report of MWASALAT [Citation9]. and the range of easy walk distance is added by the author according to the map scale).
![Figure 2. The Current Distribution of Transit Stops in Muscat Is Convenient to Limited Population Close to the Bus City Routs Based On 1 Km Euclidean Distance (The map source is the annual report of MWASALAT [Citation9]. and the range of easy walk distance is added by the author according to the map scale).](/cms/asset/e105dcf0-1505-49e9-a143-14d6f31bd124/thbr_a_2305068_f0002_oc.jpg)
Figure 3. Only 28% of the Survey Participants Live in the Convenient Walking Zone (5-10 minutes [Citation31]. – Chart prepared by the author).
![Figure 3. Only 28% of the Survey Participants Live in the Convenient Walking Zone (5-10 minutes [Citation31]. – Chart prepared by the author).](/cms/asset/ffb0ec47-38b3-4dec-b5b9-a47cd6cb708c/thbr_a_2305068_f0003_oc.jpg)
Figure 4. A Comparison Between Time to Commute by Car and to Walk to the Nearest Bus Stop for the Survey Participants (Charts prepared by the author).
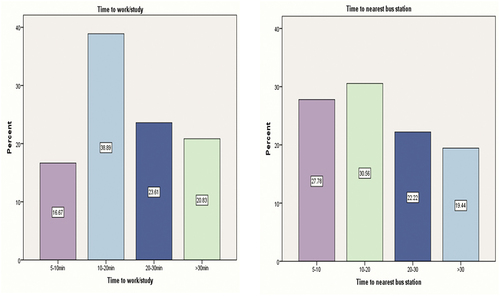
Figure 5. The Reasons Indicated by 75% of the Participants for Being Non-Public Transport Users (Chart prepared by the author).
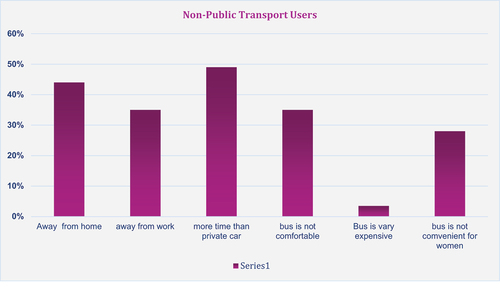
Figure 6. Most Commonly Indicated Uses and Destinations Of Car Users (Chart prepared by the author).
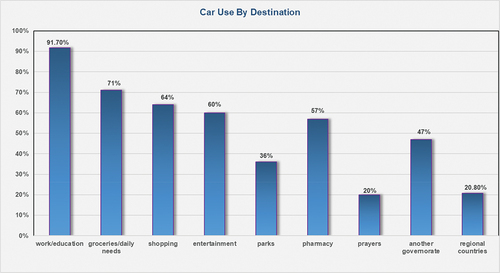
Figure 7. Factors That Would Encourage More Use of PT: Factors That Help Mitigate the Harsh Climate Were Highly Ranked (Chart prepared by the author).
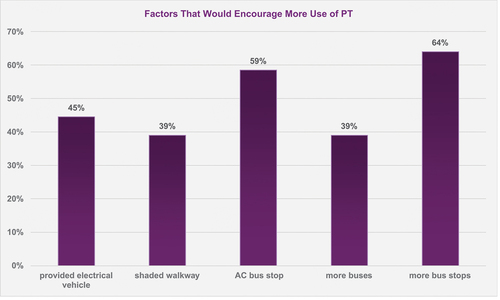
Figure 8. A proposal to change a sprawl into a walkable city (prepared by the author).
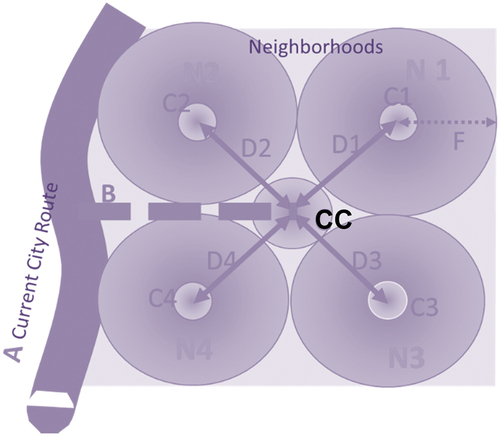
Figure 9. Madinat Al Sultan Qaboos – example of applying the suggested proposal to shift sprawl to walkable city.