
Figures & data
Table 1. Concrete mix proportions.
Figure 1. The grading curve for crushed dolomite.
Figure 2. The grading curve for fine sand.
Table 2. The chemical composites of ordinary Portland cement.
Figure 3. Mode of failure for standard A) compressive strength of cubes, B) tensile strength of cylinders.
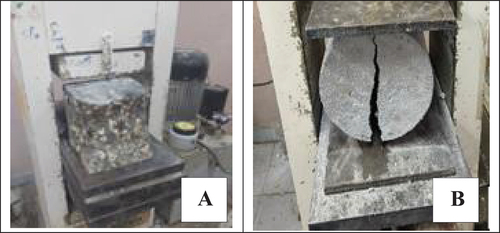
Figure 4. Tensile strength test for A) steel B) BFRP, and C) GFRP.
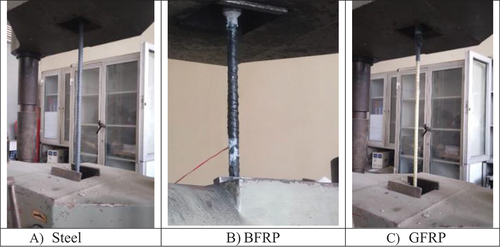
Figure 5. Ultimate tensile strength versus corresponding strains for examined BFRP and GFRP.
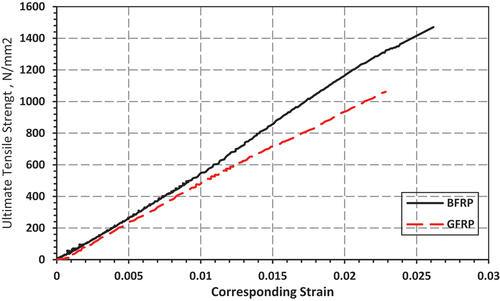
Table 3. The yield strength, ultimate strength and elongation.
Table 4. Ultimate tensile strength versus corresponding strains and modulus of elasticity of GFRP and BFRP.
Figure 6. Geometrical dimensions and reinforcement details of experimental specimen’s
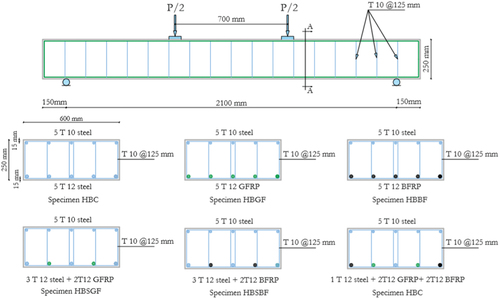
Figure 7. Specimens with different flexural reinforcement technique.
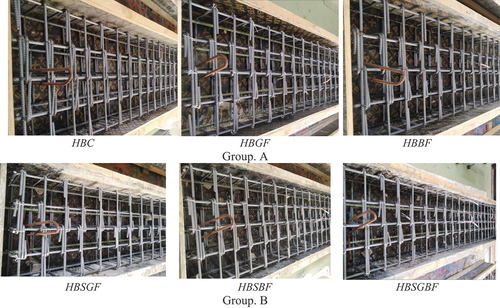
Figure 8. Test setup of all shallow wide beams (SWB) specimens.
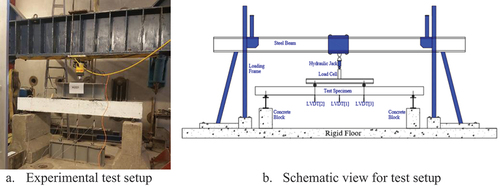
Table 5. General description for longitudinal tensile reinforcement of all the tested SWB specimens.
Figure 9. Installation of strain gauges for steel, GFRP and BFRP bars.
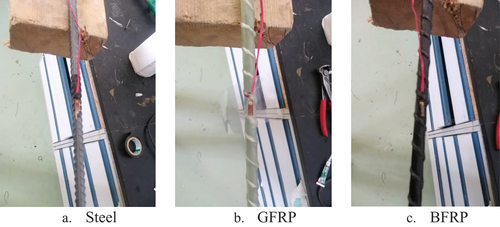
Figure 10. The crack pattern and mode of failure for all specimens.
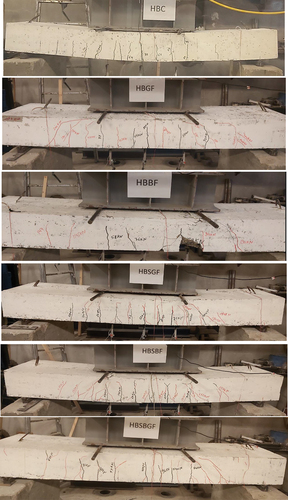
Figure 11. The schematic diagrams for crack pattern and mode of failure for all specimens.
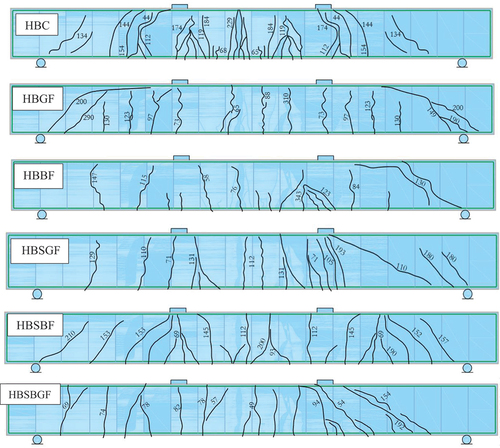
Figure 12. Deflection profile for all tested specimens.
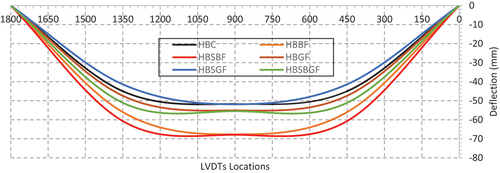
Figure 13. The load deflection curves for all tested specimens.
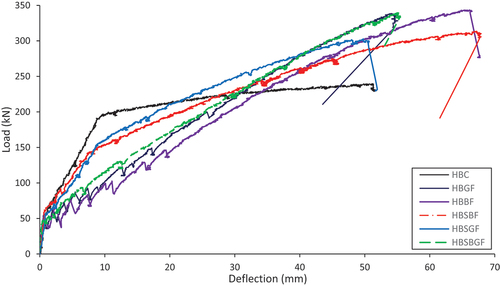
Figure 14. Recorded peak load for all specimens.
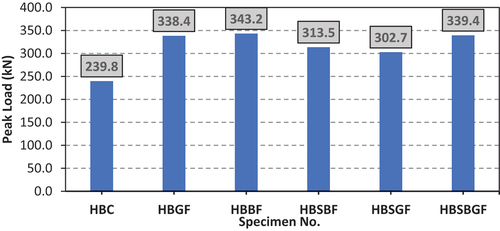
Figure 15. Recorded maximum deflection for all specimens.
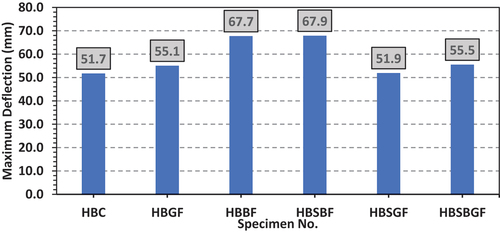
Figure 16. Recorded maximum strain in resisting tensile element for all specimens.
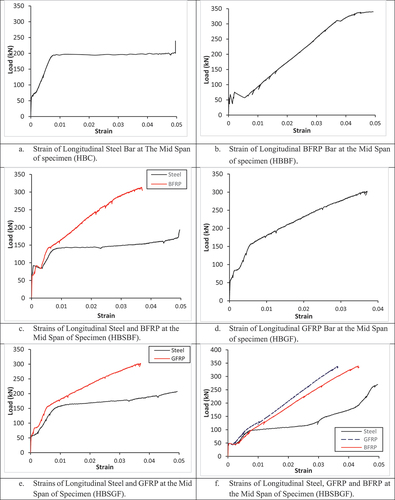
Table 6. Presentation of first cracking load, initial crack displacement, maximum load, maximum deflection, ductility index and energy absorption for tested beams.
Figure 17. Concrete compressive stress - inelastic strain.
Table 7. FEM material properties for concrete.
Figure 18. Stress-strain relationship for steel and FRP reinforcement [Citation25].
![Figure 18. Stress-strain relationship for steel and FRP reinforcement [Citation25].](/cms/asset/49331f1d-b56f-41cf-918c-cc7eaf6664c5/thbr_a_2309818_f0018_oc.jpg)
Table 8. FEM material properties for reinforcing steel bars.
Table 9. FEM material properties for BFRP bars.
Table 10. FEM material properties for GFRP bars.
Figure 19. Details of FE model for shallow wide beams.
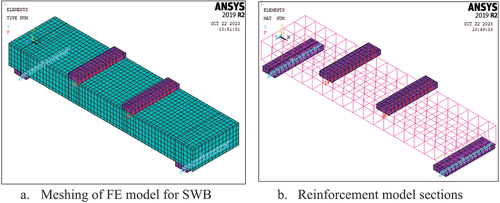
Figure 20. Load-deflection relationship of both experimental and FEA model for control beam HBC.
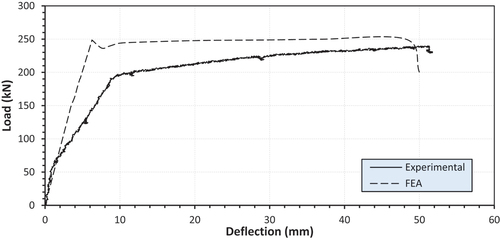
Figure 21. The crack pattern and mode of failure for both types of failure (FEA).
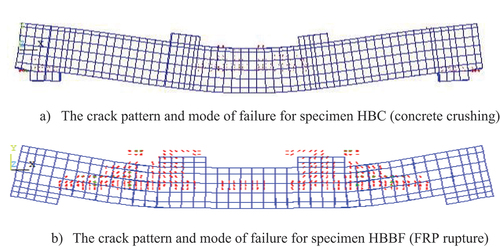
Table 11. Experimental results versus FE model results.
Figure 22. Stresses characteristics at cracking initiation stage for all specimens.
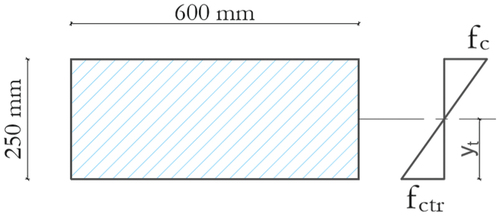
Figure 23. Stresses characteristics at ultimate stage for control specimen HBC.
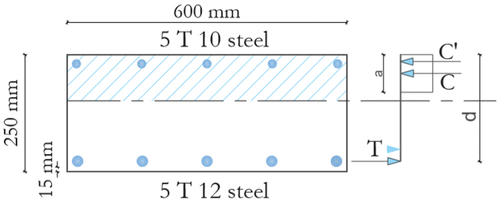
Table 12. Comparison between experimental results versus theoretical expectations.
Table 13. Comparison between experimental results versus theoretical expectations.