
Figures & data
Figure 1. MSE wall cracks in uptown Cairo, 2017.
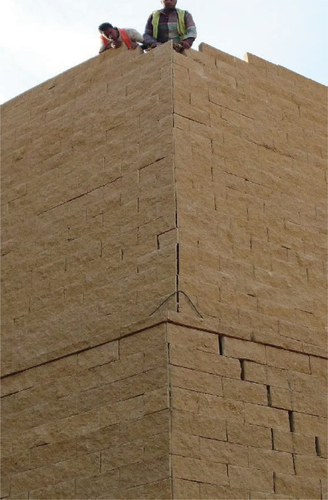
Figure 2. Cracks of curved MSEW (Andong in Korea).
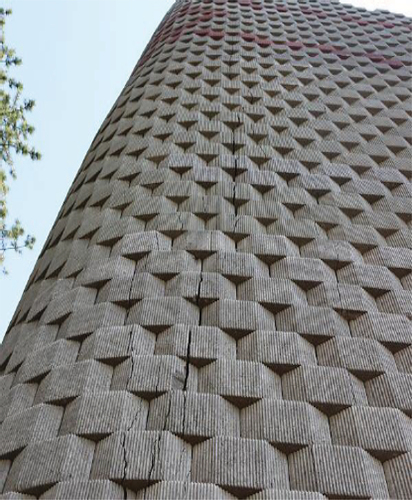
Figure 3. Model experiment overview plot.
Figure 4. Curved shape of a reinforced soil retaining wall [Citation7].
![Figure 4. Curved shape of a reinforced soil retaining wall [Citation7].](/cms/asset/2bbe7f98-fa2c-4648-b8c0-086acedef107/thbr_a_2309821_f0004_oc.jpg)
Figure 5. MSE wall 3D plaxis model.
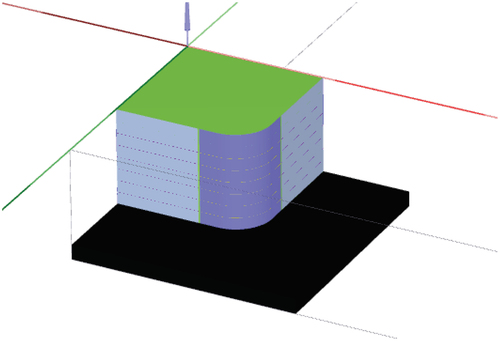
Table 1. Soil parameters.
Table 2. Facing block (plate element).
Figure 6. Horizontal displacement of facing wall at curved part from 3D plaxis model.
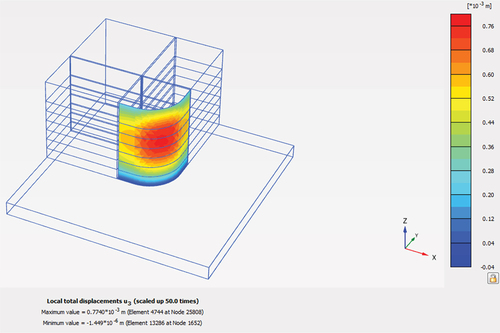
Figure 7. Horizontal displacement of facing wall at curved part for laboratory model test and 3D plaxis model.
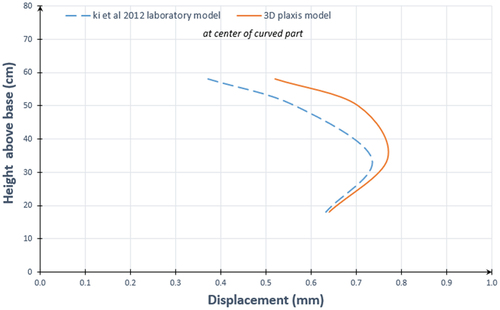
Figure 8. Horizontal displacement of facing wall at straight part for laboratory model test and 3D plaxis model.
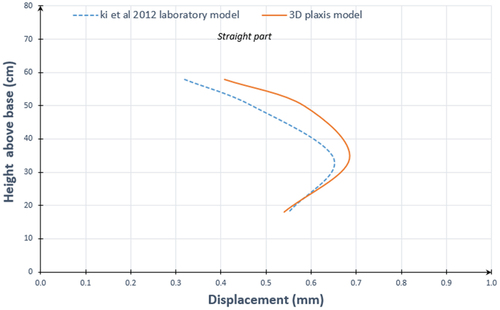
Figure 9. Cross section of MSEW [Citation8].
![Figure 9. Cross section of MSEW [Citation8].](/cms/asset/652a39ff-cb7f-4c41-adf5-379333655564/thbr_a_2309821_f0009_oc.jpg)
Table 3. Soil parameters.
Table 4. Geogrid properties.
Table 5. Facing block (plate element).
Figure 10. MSEW plaxis model based on monitoring of [Citation8].
![Figure 10. MSEW plaxis model based on monitoring of [Citation8].](/cms/asset/91830a20-11e7-4049-8b30-59b0ca91d805/thbr_a_2309821_f0010_oc.jpg)
Figure 11. Facing wall displacement in 3D plaxis model for q = 0 kPa.
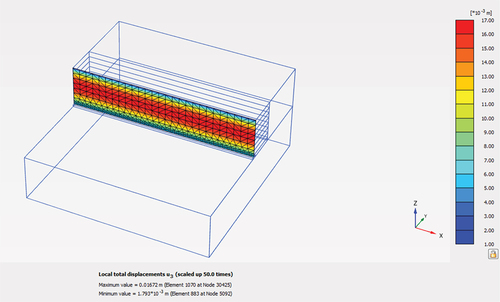
Figure 12. Lateral movements of the facing wall based on 3D plaxis model and monitoring of [Citation8] for q = 0 kPa.
![Figure 12. Lateral movements of the facing wall based on 3D plaxis model and monitoring of [Citation8] for q = 0 kPa.](/cms/asset/136ca489-16f9-4b2f-87e1-f9b8c4db6613/thbr_a_2309821_f0012_oc.jpg)
Figure 13. A random section studied for this research.
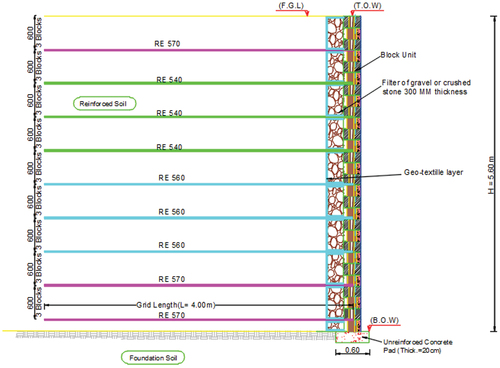
Table 6. Input hardening soil model parameters of backfill soil.
Table 7. Geogrid properties.
Table 8. Facing block (plate element).
Figure 14. A plan of MSEW in case of right-angle and curved wal.
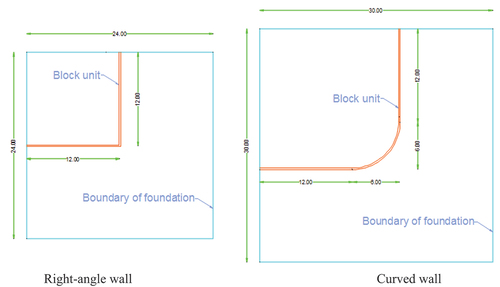
Figure 15. 3D plaxis model for MSEW.
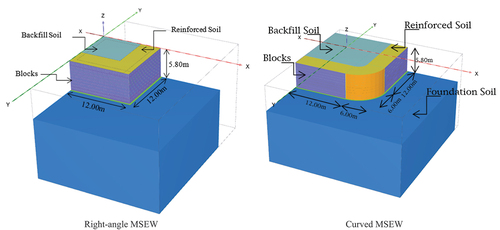
Figure 16. 3D plaxis model for curved wall with difference angle.
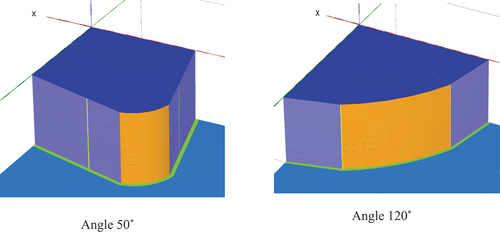
Figure 17. Facing wall displacement.
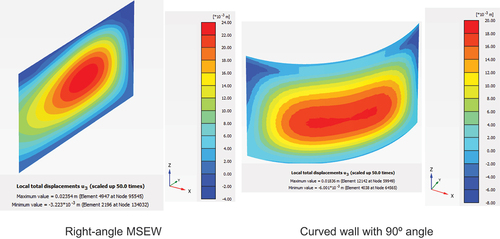
Figure 18. Comparison of wall facing displacement for right-angle and curved wall with 90º angle.
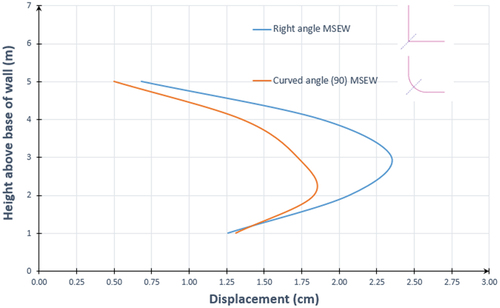
Figure 19. Maximum facing wall displacement.
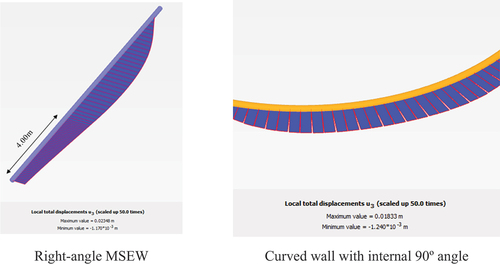
Figure 20. Strain distribution across the geogrid layers.
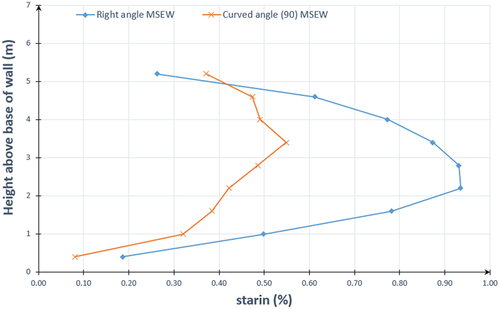
Figure 21. Wall facing displacement for curved wall with different angles from 50 to 120.
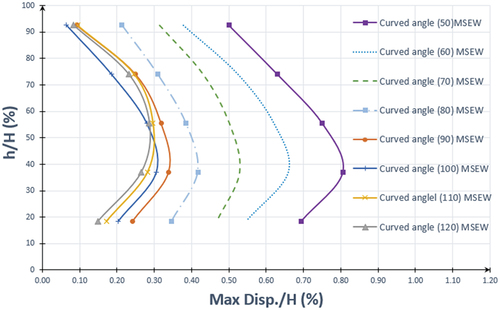
Figure 22. Factor of safety for curved wall with different internal curved angles from 50 to 120.
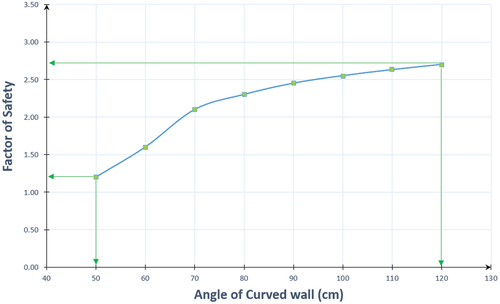
Figure 23. Maximum displacement per height of wall with different angles of curved wall.
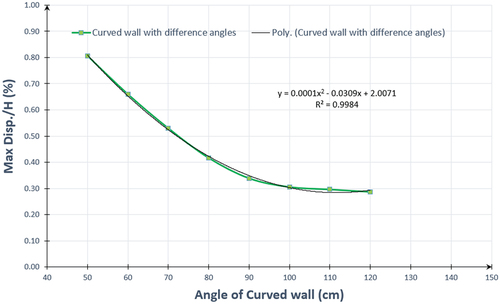
Table 9. The specific locations of wall failure for different internal angles
Figure 24. Facing wall displacement for curved wall with different angles from 50 to 120.
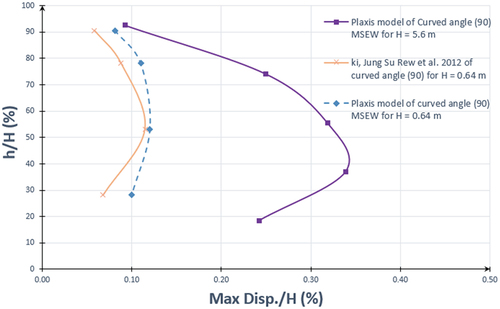
Table 10. Maximum force at geogrid layer.