
Figures & data
Table 1. Details of the experimental specimens used for verification.
Figure 1. Load–deflection curves between test and FE models, a) Ahmed et al.[Citation1], and b) M.A.L.Silva, et al. [Citation28].
![Figure 1. Load–deflection curves between test and FE models, a) Ahmed et al.[Citation1], and b) M.A.L.Silva, et al. [Citation28].](/cms/asset/c5dc4be9-8488-465a-a12d-4180b6cb9def/thbr_a_2310936_f0001_oc.jpg)
Table 2. Finite element modeling accuracy.
Figure 2. Frequency distribution of input variables.
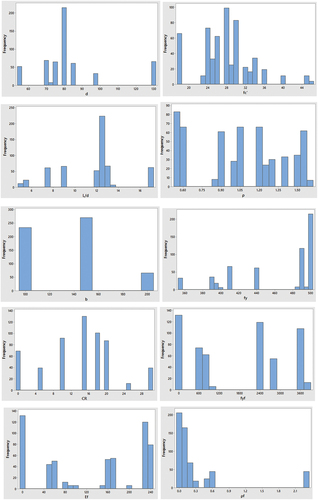
Table 3. Variables statistical description.
Figure 3. Correlation plot of the dataset between each input variable and the PS capacity.
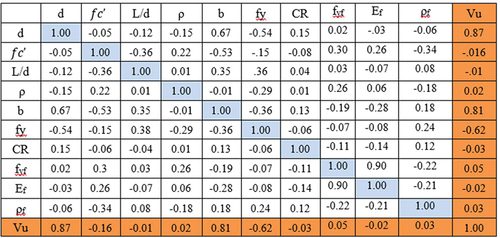
Figure 4. ANN model composed of eight neurons in one hidden layer.
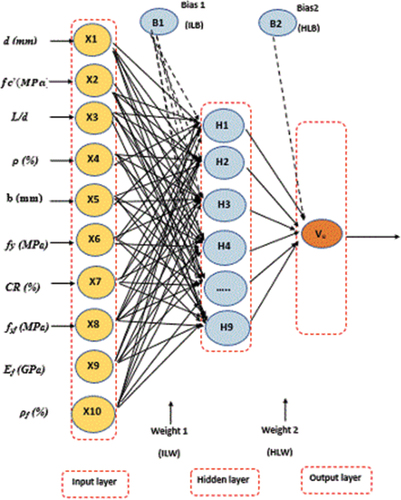
Figure 5. Performance of the ANN model.
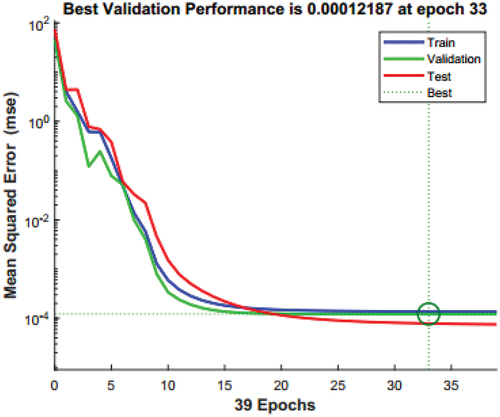
Figure 6. Regression analysis for training, validation, testing, and all data of ANN model.
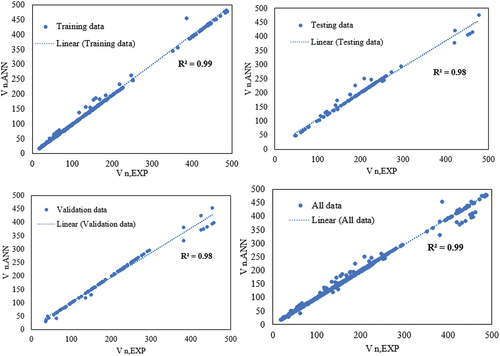
Figure 7. Comparison between all models.
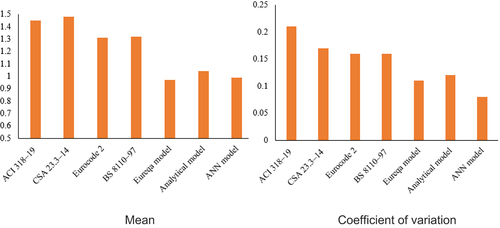
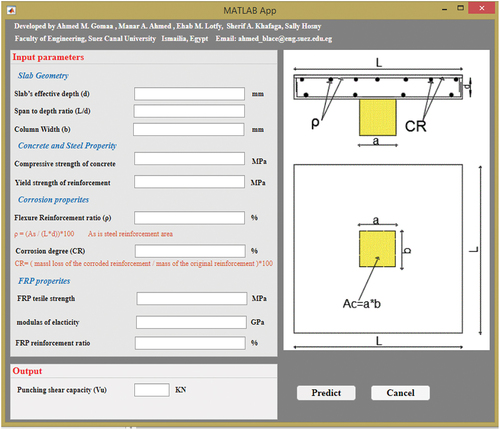
Figure 8. Graphical user interface (GUI) for the proposed ANN model.
Supplemental material