
Figures & data
Figure 1. Literature review methodology. “Source. Authors’’.
Figure 2. Publication period of analyzed studies. “Source. Authors’’.
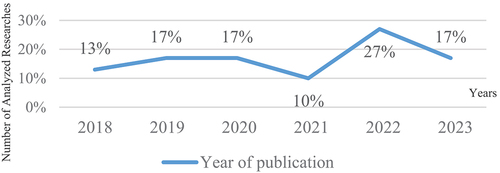
Figure 3. Types of the located studies. “Source. Authors’’.
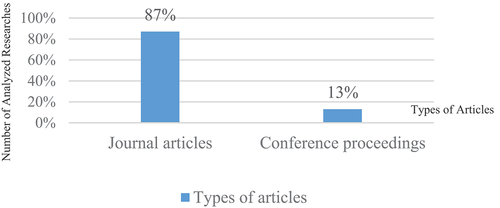
Figure 4. Classification of construction waste. “Source. Authors after [Citation11,Citation12]’’.
![Figure 4. Classification of construction waste. “Source. Authors after [Citation11,Citation12]’’.](/cms/asset/26f73651-0a4a-4379-a218-ff1293fa6741/thbr_a_2318502_f0004_b.gif)
Table 1. Root causes of construction waste.
Figure 5. Design phase stages “source. Authors after [Citation16]’’.
![Figure 5. Design phase stages “source. Authors after [Citation16]’’.](/cms/asset/7afbfeab-65b9-4e37-98d4-aac01c8c1147/thbr_a_2318502_f0005_b.gif)
Table 2. Causes and sources of design waste.
Table 3. Waste in the context of lean.
Table 4. Lean design waste items.
Table 5. Impact of waste reduction on sustainability.
Table 6. Relationship matrix between lean wastes and sustainability impacts related to ‘resources and material’ waste.
Table 7. Designing out waste strategy principles.
Table 8. Matrix for construction waste reduction from the early design phase.