
Figures & data
Table 1. High-rise/super high-rise building classification.
Table 2. Description of emergency evacuation scenarios.
Table 3. Comparison of refuge floor location among countries.
Figure 1. Research methodology.
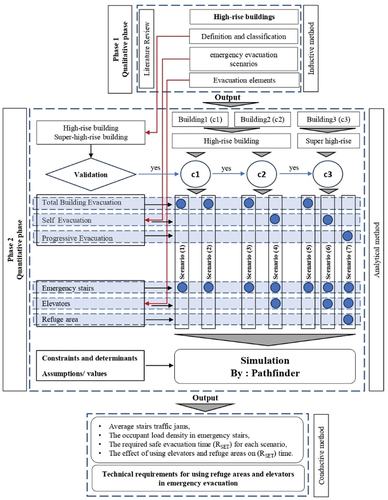
Table 4. Description of the buildings.
Table 5. The architectural requirements of the Egyptian code for protecting buildings from fire and international codes.
Table 6. The constraints and determinants of the study.
Figure 2. The change of the type of the staircases (No:1, No:2, and No:6) in the typical floor for scenarios (1), and (2).
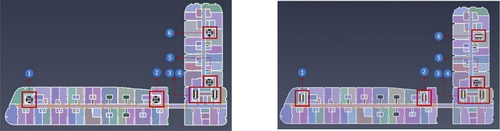
Figure 3. The evacuation assumptions for building (2), scenarios (3), and (4).
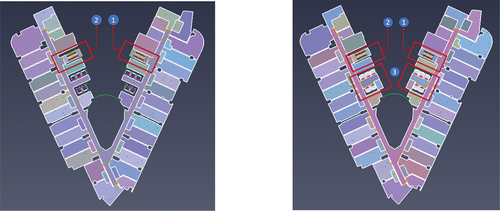
Figure 4. The evacuation assumptions for building (3), scenarios (5), (6), and (7).
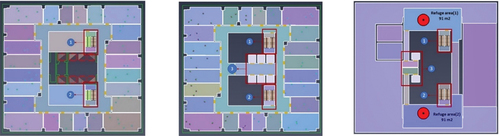
Figure 5. (a, b). The total evacuation time for scenario 1 and 2.
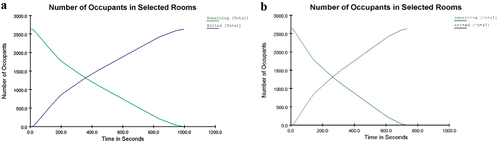
Table 7. The occupants’ behavior for scenario 1, and 2.
Figure 6. The density(occs/m2) for emergency stairs in scenario 1.
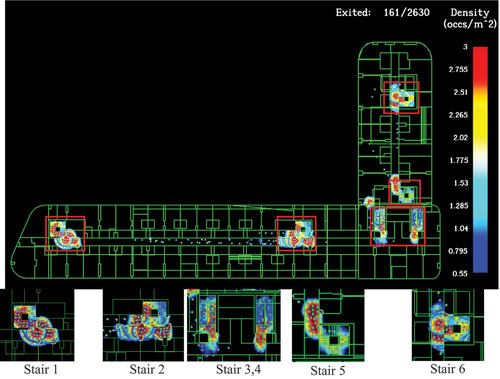
Figure 7. The density (Occs/m2) for emergency stairs in scenario 2.
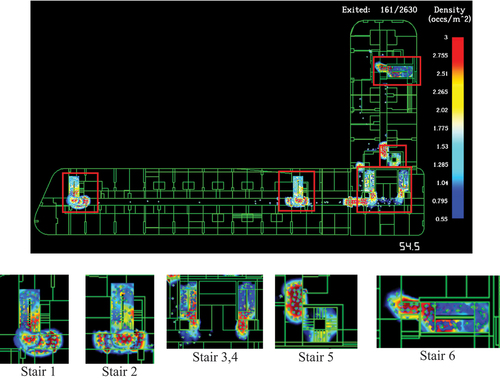
Figure 8. (a, b). The total evacuation time for scenario (3), and (4).
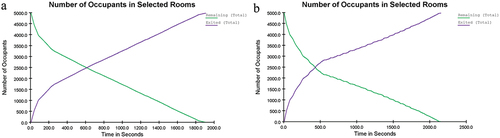
Table 8. The occupants’ behavior for the for scenario (3), and (4).
Figure 9. The density (Occs/m2) for emergency stairs in scenario 3.
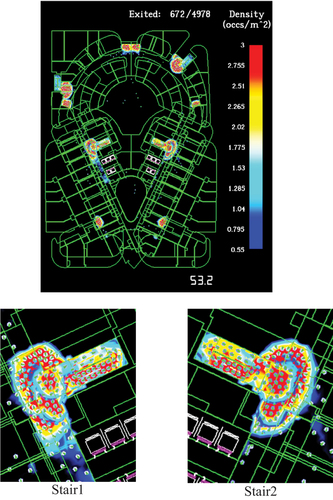
Figure 10. The density (Occs/m2) for emergency stairs in scenario 4.
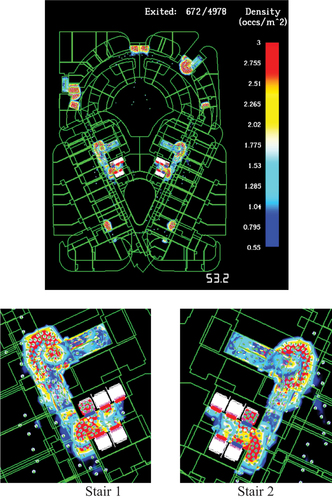
Figure 11. (a,b, and c) The total evacuation time for scenario (5), (6), and (7).
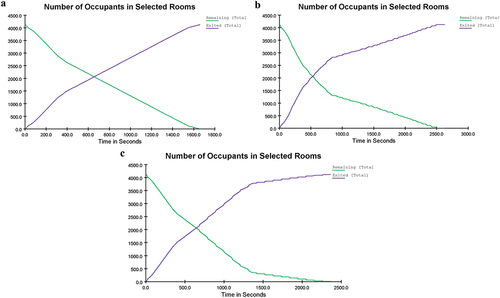
Table 9. The occupants’ behavior for scenario (5), (6), and (7).
Figure 12. The density (Occs/m2) for emergency stairs in scenario 5.
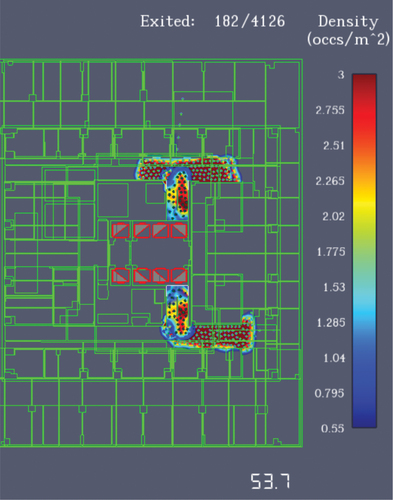
Figure 13. The density (Occs/m2) for emergency stairs in scenario 6.
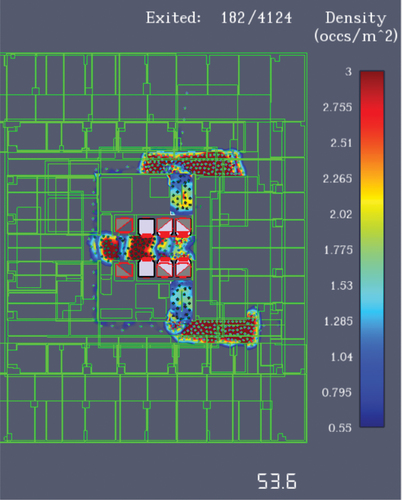
Figure 14. The density (Occs/m2) for refuge areas in scenario 7.
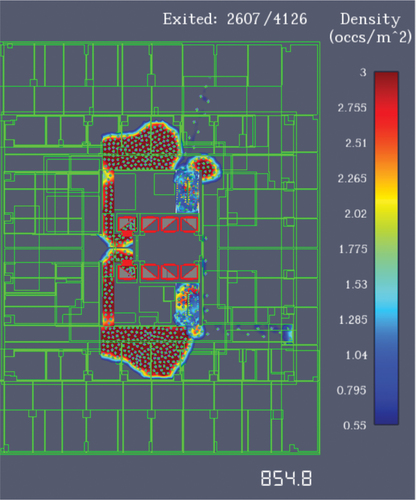
Figure 15. Two refuge area on level (+91.8, the 24th floor).
Figure 16. The required safe evacuation time (RSET) for the seven scenarios.
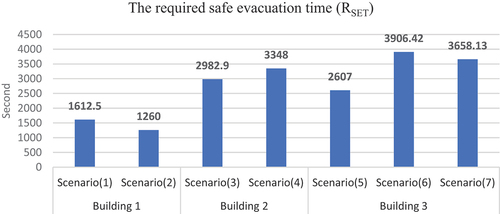
Figure 17. The average stairs traffic jams for the seven scenarios.
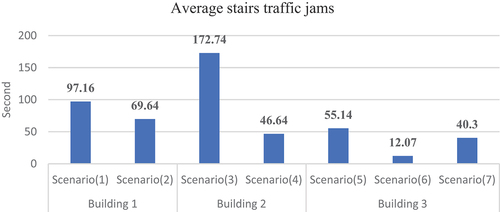
Figure 18. The simulation process by using elevators in scenario (4).

Table 10. The (Tmove) for the commercial floors in the three buildings.
Table 11. The requirements for refuge areas.
Table 12. The requirements for the elevators.