
Figures & data
Table 1. Acrylic powder components.
Figure 1. Brazilian tensile strength test setup.
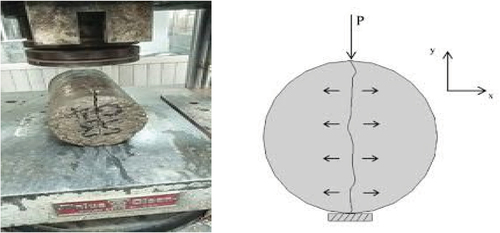
Table 2. Brazilian tensile strength test results.
Figure 2. Stress-strain curve of polymer concrete mix and its failure.
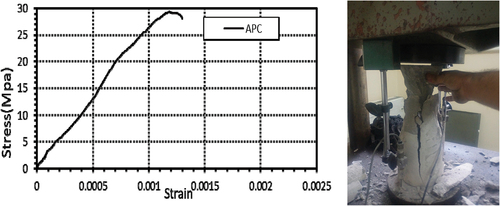
Table 3. Mechanical properties of steel bars.
Figure 3. Typical solid specimen details.
Figure 4. Typical details for specimen with openings.
Figure 5. Details for enhancement specimens.
Table 4. Details of tested specimens.
Figure 6. Test setup.
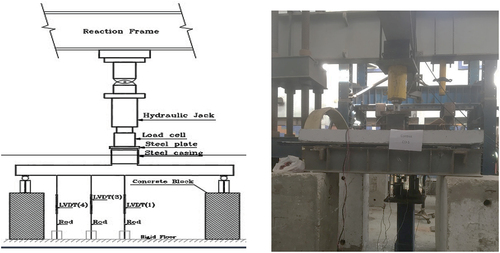
Figure 7. LVDTS arrangement under the specimen test.
Figure 8. Load-deflection curve for the control specimens group specimens (CO-0-C&CO-S&p-S).
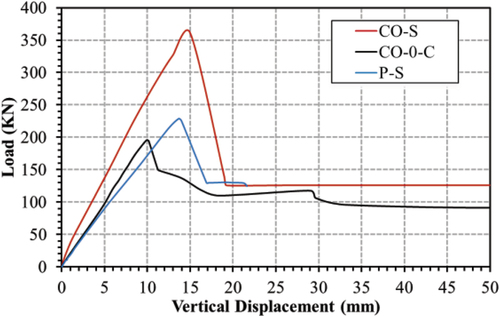
Table 5. Summary of test results.
Figure 9. Load displacement curve for (p-S& p-0-C& P-d-C& p-3d-C).
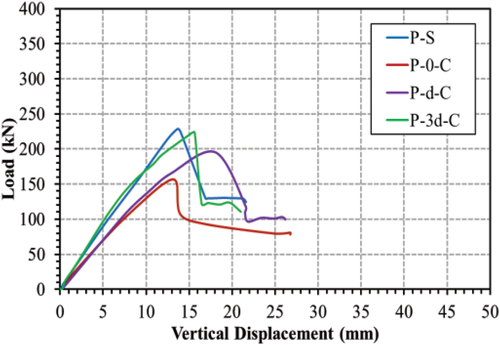
Figure 10. Load displacement curve for specimens (p-S & p-0-0.5C & P-d-0.5C & p-3d-0.5C).
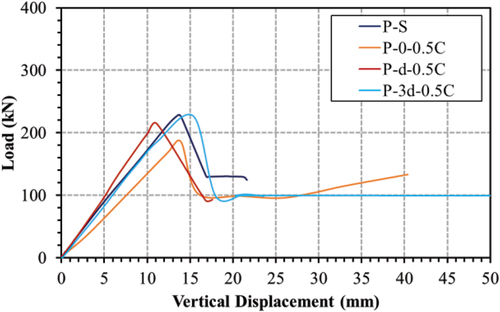
Figure 11. Load displacement curve for specimens (p-0-C & p-B & p-L & p-F).
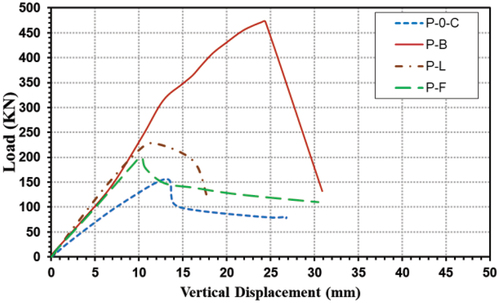
Figure 12. Response of concrete to uniaxial loading in a) tension b) compression.
Figure 13. Stress-strain relationship for steel reinforcement.
Table 6. Comparison between experimental and theoretical results.
Table 7. Experimental and theoretical curves and failure mode shape.