
Figures & data
Figure 1. SEM image shows the formation of nano carbonates (CaCO3) as a result of the addition of CO2 to the concrete material (photo by CarbonCure technologies).
Figure 2. Pressurized CO2 gas in a storage tank at the mixing site of qanbar ready mix concrete, Saudi Arabia (photo by author).
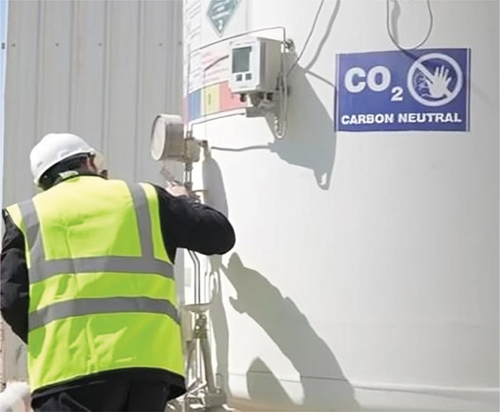
Table 1. Mix design proportions for the reference and CarbonCure mixes (kg/m3.).
Figure 3. The CO2-concrete product is being cast in 6 x 12-inch cylinders at qanbar ready mix concrete, Saudi Arabia (photo by gulf construction).
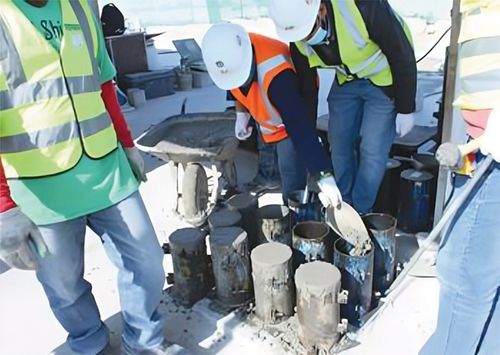
Figure 4. Tests on the temperature at various time intervals.

Table 2. The chemical analysis of water in the Arabian gulf compared to drinkable water.
Figure 5. Fresh properties for the reference and CarbonCure mixes.
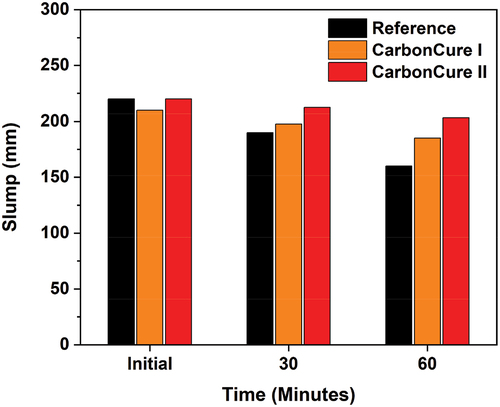
Figure 6. Compressive strength results for the reference and CarbonCure mixes.
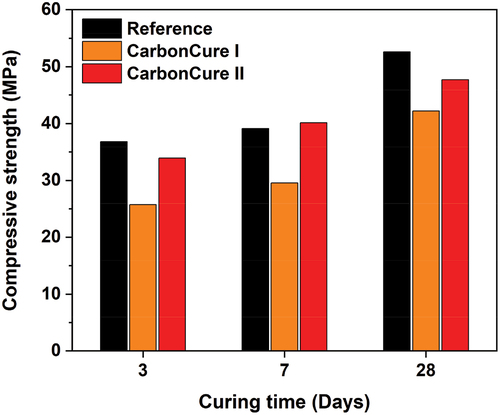
Figure 7. Concrete densities for the reference and CarbonCure mixes.
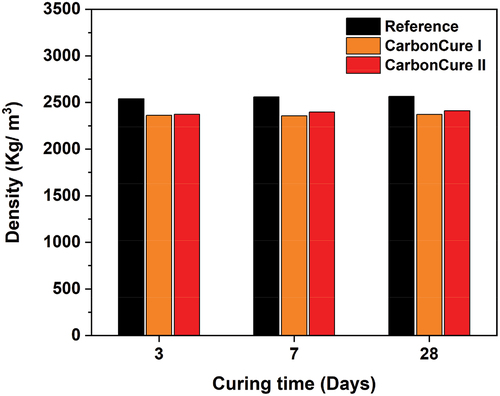
Figure 8. Water absorption results for the reference and CarbonCure mixes.
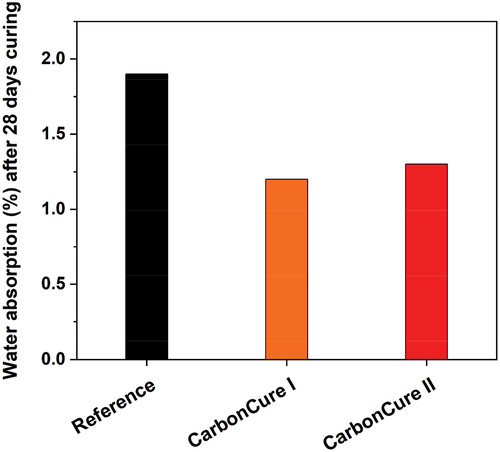
Figure 9. Chloride permeability results for the reference and CarbonCure mixes.
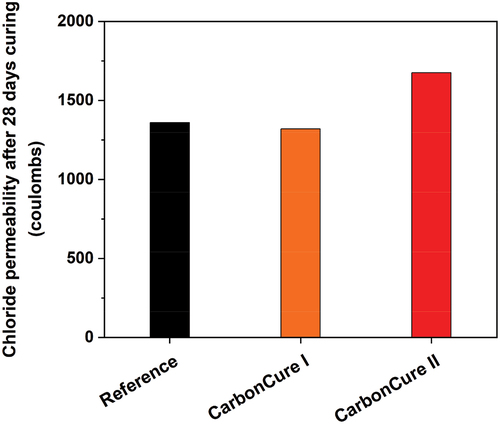
Figure 10. Water soluble chloride ion contents for the reference and CarbonCure mixes.
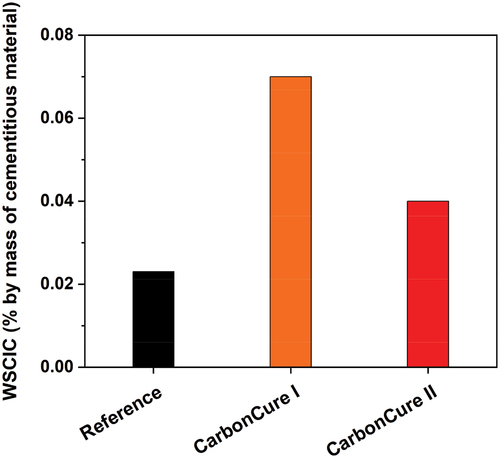
Figure 11. Acid soluble sulfate ion contents results for the reference and CarbonCure mixes.
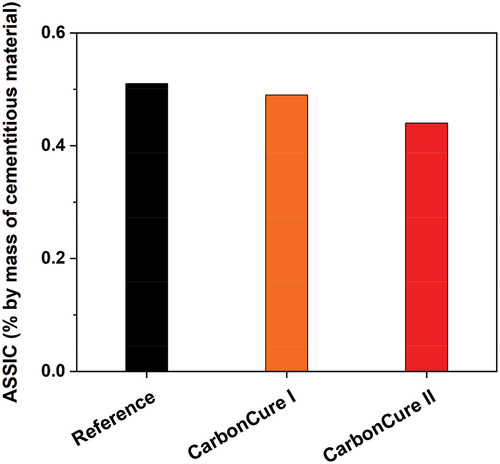
Table 3. Efficiency of cement and cementitious materials in reference and CarbonCure mixes (MPa∙kg−1∙m3).
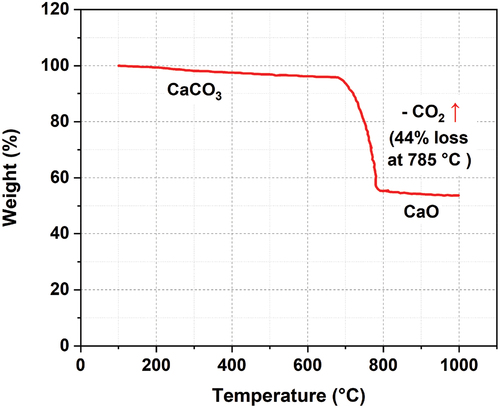
Figure 12. TGA weight loss of CaCO3 heated to 1000 ºC at a heating rate of 10 ºC/min.
Data availability statement
Data will be made available upon request.